Report 2010 - Italcementi Group
Report 2010 - Italcementi Group
Report 2010 - Italcementi Group

You also want an ePaper? Increase the reach of your titles
YUMPU automatically turns print PDFs into web optimized ePapers that Google loves.
<strong>2010</strong> Annual <strong>Report</strong><br />
Presentazione 6<br />
Consolidated Annual <strong>Report</strong> Directors’ report 27<br />
Corporate Governance Consolidated financial statements Financial statements 68<br />
<strong>Italcementi</strong> S.p.A. financial statements Notes 73<br />
Annexes 142<br />
<strong>Report</strong> of the Independent Auditors 151<br />
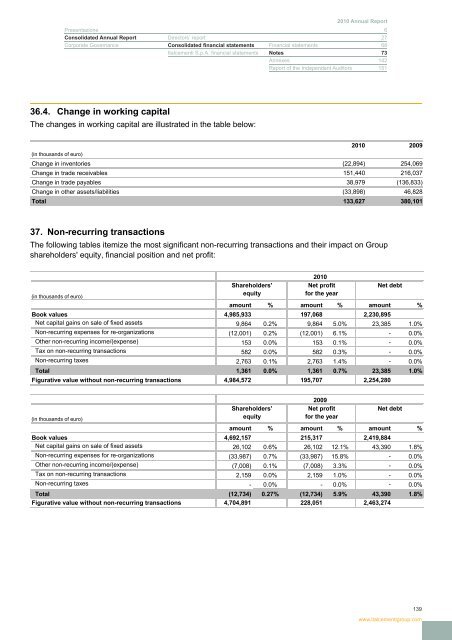
36.4. Change in working capital<br />
The changes in working capital are illustrated in the table below:<br />
<strong>2010</strong> 2009<br />
(in thousands of euro)<br />
Change in inventories (22,894) 254,069<br />
Change in trade receivables 151,440 216,037<br />
Change in trade payables 38,979 (136,833)<br />
Change in other assets/liabilities (33,898) 46,828<br />
Total 133,627 380,101<br />
37. Non-recurring transactions<br />
The following tables itemize the most significant non-recurring transactions and their impact on <strong>Group</strong><br />
shareholders' equity, financial position and net profit:<br />
<strong>2010</strong><br />
Shareholders'<br />
Net profit<br />
Net debt<br />
(in thousands of euro)<br />
equity<br />
for the year<br />
amount % amount % amount %<br />
Book values 4,985,933 197,068 2,230,895<br />
Net capital gains on sale of fixed assets 9,864 0.2% 9,864 5.0% 23,385 1.0%<br />
Non-recurring expenses for re-organizations (12,001) 0.2% (12,001) 6.1% - 0.0%<br />
Other non-recurring income/(expense) 153 0.0% 153 0.1% - 0.0%<br />
Tax on non-recurring transactions 582 0.0% 582 0.3% - 0.0%<br />
Non-recurring taxes 2,763 0.1% 2,763 1.4% - 0.0%<br />
Total 1,361 0.0% 1,361 0.7% 23,385 1.0%<br />
Figurative value without non-recurring transactions 4,984,572 195,707 2,254,280<br />
2009<br />
Shareholders'<br />
Net profit<br />
Net debt<br />
(in thousands of euro)<br />
equity<br />
for the year<br />
amount % amount % amount %<br />
Book values 4,692,157 215,317 2,419,884<br />
Net capital gains on sale of fixed assets 26,102 0.6% 26,102 12.1% 43,390 1.8%<br />
Non-recurring expenses for re-organizations (33,987) 0.7% (33,987) 15.8% - 0.0%<br />
Other non-recurring income/(expense) (7,008) 0.1% (7,008) 3.3% - 0.0%<br />
Tax on non-recurring transactions 2,159 0.0% 2,159 1.0% - 0.0%<br />
Non-recurring taxes - 0.0% - 0.0% - 0.0%<br />
Total (12,734) 0.27% (12,734) 5.9% 43,390 1.8%<br />
Figurative value without non-recurring transactions 4,704,891 228,051 2,463,274<br />
139<br />
www.italcementigroup.com