- Page 1 and 2:
Version 10 Using JMP “The real vo
- Page 3:
USE, DATA OR PROFITS, WHETHER IN AN
- Page 6 and 7:
6 Open Data Files . . . . . . . . .
- Page 8 and 9:
8 Delete All Row Characteristics .
- Page 10 and 11:
10 Order Expressions in Formulas .
- Page 12 and 13:
12 Change the Marker Drawing Mode a
- Page 14 and 15:
14 A Change Customization Sets . .
- Page 17 and 18:
Chapter 1 Learn About JMP Documenta
- Page 19 and 20:
Chapter 1 Learn About JMP 19 Book C
- Page 21 and 22:
Chapter 1 Learn About JMP 21 Book C
- Page 23 and 24:
Chapter 1 Learn About JMP 23 Additi
- Page 25 and 26:
Chapter 1 Learn About JMP 25 Additi
- Page 27 and 28:
Chapter 2 Get Started Introduction
- Page 29 and 30:
Chapter 2 Get Started 29 JMP Home W
- Page 31 and 32:
Chapter 2 Get Started 31 JMP Starte
- Page 33 and 34:
Chapter 2 Get Started 33 Data Table
- Page 35 and 36:
Chapter 2 Get Started 35 Data Table
- Page 37 and 38:
Chapter 2 Get Started 37 Data Table
- Page 39 and 40:
Chapter 2 Get Started 39 Data Table
- Page 41 and 42:
Chapter 2 Get Started 41 Data Table
- Page 43 and 44:
Chapter 2 Get Started 43 Open Data
- Page 45 and 46:
Chapter 2 Get Started 45 Display an
- Page 47 and 48:
Chapter 2 Get Started 47 Anatomy of
- Page 49 and 50:
Chapter 2 Get Started 49 Anatomy of
- Page 51 and 52:
Chapter 3 Import Your Data Create D
- Page 53 and 54:
Chapter 3 Import Your Data 53 About
- Page 55 and 56:
Chapter 3 Import Your Data 55 Impor
- Page 57 and 58:
Chapter 3 Import Your Data 57 Impor
- Page 59 and 60:
Chapter 3 Import Your Data 59 Impor
- Page 61 and 62:
Chapter 3 Import Your Data 61 Impor
- Page 63 and 64:
Chapter 3 Import Your Data 63 Impor
- Page 65 and 66:
Chapter 3 Import Your Data 65 Impor
- Page 67 and 68:
Chapter 3 Import Your Data 67 Impor
- Page 69 and 70:
Chapter 3 Import Your Data 69 Impor
- Page 71 and 72:
Chapter 3 Import Your Data 71 Impor
- Page 73 and 74:
Chapter 3 Import Your Data 73 Impor
- Page 75 and 76:
Chapter 3 Import Your Data 75 Impor
- Page 77 and 78:
Chapter 3 Import Your Data 77 Impor
- Page 79 and 80:
Chapter 3 Import Your Data 79 Impor
- Page 81 and 82:
Chapter 3 Import Your Data 81 Impor
- Page 83 and 84:
Chapter 3 Import Your Data 83 Impor
- Page 85 and 86:
Chapter 3 Import Your Data 85 Impor
- Page 87 and 88:
Chapter 3 Import Your Data 87 Impor
- Page 89 and 90:
Chapter 3 Import Your Data 89 Impor
- Page 91 and 92:
Chapter 3 Import Your Data 91 Impor
- Page 93 and 94:
Chapter 3 Import Your Data 93 Impor
- Page 95 and 96:
Chapter 3 Import Your Data 95 Impor
- Page 97 and 98:
Chapter 3 Import Your Data 97 Read
- Page 99 and 100:
Chapter 3 Import Your Data 99 Creat
- Page 101 and 102:
Chapter 4 Enter and Edit Data Perfo
- Page 103 and 104:
Chapter 4 Enter and Edit Data 103 E
- Page 105 and 106:
Chapter 4 Enter and Edit Data 105 E
- Page 107 and 108:
Chapter 4 Enter and Edit Data 107 S
- Page 109 and 110:
Chapter 4 Enter and Edit Data 109 S
- Page 111 and 112:
Chapter 4 Enter and Edit Data 111 S
- Page 113 and 114:
Chapter 4 Enter and Edit Data 113 E
- Page 115 and 116:
Chapter 4 Enter and Edit Data 115 E
- Page 117 and 118:
Chapter 4 Enter and Edit Data 117 E
- Page 119 and 120:
Chapter 4 Enter and Edit Data 119 E
- Page 121 and 122:
Chapter 4 Enter and Edit Data 121 E
- Page 123 and 124:
Chapter 4 Enter and Edit Data 123 E
- Page 125 and 126:
Chapter 4 Enter and Edit Data 125 E
- Page 127 and 128:
Chapter 4 Enter and Edit Data 127 E
- Page 129 and 130:
Chapter 4 Enter and Edit Data 129 E
- Page 131 and 132:
Chapter 4 Enter and Edit Data 131 A
- Page 133 and 134:
Chapter 4 Enter and Edit Data 133 A
- Page 135 and 136:
Chapter 4 Enter and Edit Data 135 A
- Page 137 and 138:
Chapter 4 Enter and Edit Data 137 A
- Page 139 and 140:
Chapter 4 Enter and Edit Data 139 A
- Page 141 and 142:
Chapter 5 Set Column Properties The
- Page 143 and 144:
Chapter 5 Set Column Properties 143
- Page 145 and 146:
Chapter 5 Set Column Properties 145
- Page 147 and 148:
Chapter 5 Set Column Properties 147
- Page 149 and 150:
Chapter 5 Set Column Properties 149
- Page 151 and 152:
Chapter 5 Set Column Properties 151
- Page 153 and 154:
Chapter 5 Set Column Properties 153
- Page 155 and 156:
Chapter 5 Set Column Properties 155
- Page 157 and 158:
Chapter 5 Set Column Properties 157
- Page 159 and 160:
Chapter 5 Set Column Properties 159
- Page 161 and 162:
Chapter 5 Set Column Properties 161
- Page 163 and 164:
Chapter 5 Set Column Properties 163
- Page 165 and 166:
Chapter 6 Reshape Data Create Subse
- Page 167 and 168:
Chapter 6 Reshape Data 167 Create a
- Page 169 and 170:
Chapter 6 Reshape Data 169 Create a
- Page 171 and 172:
Chapter 6 Reshape Data 171 Sort Dat
- Page 173 and 174:
Chapter 6 Reshape Data 173 Stack Co
- Page 175 and 176:
Chapter 6 Reshape Data 175 Stack Co
- Page 177 and 178:
Chapter 6 Reshape Data 177 Split Co
- Page 179 and 180:
Chapter 6 Reshape Data 179 Split Co
- Page 181 and 182:
Chapter 6 Reshape Data 181 Transpos
- Page 183 and 184: Chapter 6 Reshape Data 183 Transpos
- Page 185 and 186: Chapter 6 Reshape Data 185 Concaten
- Page 187 and 188: Chapter 6 Reshape Data 187 Concaten
- Page 189 and 190: Chapter 6 Reshape Data 189 Join Dat
- Page 191 and 192: Chapter 6 Reshape Data 191 Join Dat
- Page 193 and 194: Chapter 6 Reshape Data 193 Join Dat
- Page 195 and 196: Chapter 6 Reshape Data 195 Join Dat
- Page 197 and 198: Chapter 6 Reshape Data 197 Join Dat
- Page 199 and 200: Chapter 6 Reshape Data 199 Update D
- Page 201 and 202: Chapter 6 Reshape Data 201 Update D
- Page 203 and 204: Chapter 7 Formula Editor Construct
- Page 205 and 206: Chapter 7 Formula Editor 205 Create
- Page 207 and 208: Chapter 7 Formula Editor 207 Use Lo
- Page 209 and 210: Chapter 7 Formula Editor 209 Insert
- Page 211 and 212: Chapter 7 Formula Editor 211 Use Fu
- Page 213 and 214: Chapter 7 Formula Editor 213 Use Fu
- Page 215 and 216: Chapter 7 Formula Editor 215 Order
- Page 217 and 218: Chapter 7 Formula Editor 217 Use Fo
- Page 219 and 220: Chapter 7 Formula Editor 219 Edit F
- Page 221 and 222: Chapter 7 Formula Editor 221 Custom
- Page 223 and 224: Chapter 7 Formula Editor 223 Exampl
- Page 225 and 226: Chapter 7 Formula Editor 225 Exampl
- Page 227 and 228: Chapter 7 Formula Editor 227 Keyboa
- Page 229 and 230: Chapter 7 Formula Editor 229 Glossa
- Page 231 and 232: Chapter 8 Summarize Data The Summar
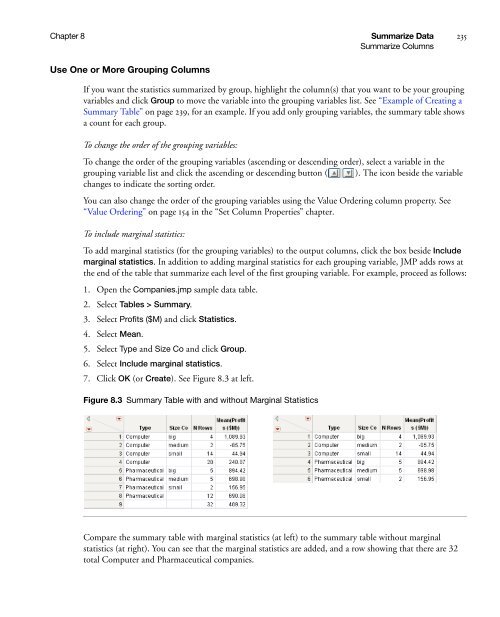
- Page 233: Chapter 8 Summarize Data 233 Summar
- Page 237 and 238: Chapter 8 Summarize Data 237 Summar
- Page 239 and 240: Chapter 8 Summarize Data 239 Summar
- Page 241 and 242: Chapter 8 Summarize Data 241 Tabula
- Page 243 and 244: Chapter 8 Summarize Data 243 Tabula
- Page 245 and 246: Chapter 8 Summarize Data 245 Tabula
- Page 247 and 248: Chapter 8 Summarize Data 247 Tabula
- Page 249 and 250: Chapter 8 Summarize Data 249 Tabula
- Page 251 and 252: Chapter 8 Summarize Data 251 Tabula
- Page 253 and 254: Chapter 8 Summarize Data 253 Tabula
- Page 255 and 256: Chapter 8 Summarize Data 255 Tabula
- Page 257 and 258: Chapter 9 JMP Platforms Launch and
- Page 259 and 260: Chapter 9 JMP Platforms 259 Launch
- Page 261 and 262: Chapter 9 JMP Platforms 261 Navigat
- Page 263 and 264: Chapter 9 JMP Platforms 263 Navigat
- Page 265 and 266: Chapter 9 JMP Platforms 265 How to
- Page 267 and 268: Chapter 9 JMP Platforms 267 How to
- Page 269 and 270: Chapter 9 JMP Platforms 269 The Dat
- Page 271 and 272: Chapter 9 JMP Platforms 271 The Dat
- Page 273 and 274: Chapter 9 JMP Platforms 273 The Dat
- Page 275 and 276: Chapter 9 JMP Platforms 275 The Dat
- Page 277 and 278: Chapter 9 JMP Platforms 277 The Dat
- Page 279 and 280: Chapter 9 JMP Platforms 279 Select
- Page 281 and 282: Chapter 9 JMP Platforms 281 Use Mar
- Page 283 and 284: Chapter 9 JMP Platforms 283 Use Mar
- Page 285 and 286:
Chapter 9 JMP Platforms 285 Use Mar
- Page 287 and 288:
Chapter 9 JMP Platforms 287 Alter P
- Page 289 and 290:
Chapter 9 JMP Platforms 289 Alter P
- Page 291 and 292:
Chapter 9 JMP Platforms 291 Alter P
- Page 293 and 294:
Chapter 9 JMP Platforms 293 Alter P
- Page 295 and 296:
Chapter 9 JMP Platforms 295 Alter P
- Page 297 and 298:
Chapter 9 JMP Platforms 297 Alter P
- Page 299 and 300:
Chapter 9 JMP Platforms 299 Alter P
- Page 301 and 302:
Chapter 9 JMP Platforms 301 Alter P
- Page 303 and 304:
Chapter 9 JMP Platforms 303 Alter P
- Page 305 and 306:
Chapter 9 JMP Platforms 305 Add Gra
- Page 307 and 308:
Chapter 9 JMP Platforms 307 Add Gra
- Page 309 and 310:
Chapter 9 JMP Platforms 309 Add Gra
- Page 311 and 312:
Chapter 9 JMP Platforms 311 Add Gra
- Page 313 and 314:
Chapter 9 JMP Platforms 313 Add Gra
- Page 315 and 316:
Chapter 10 Save and Share Data Get
- Page 317 and 318:
Chapter 10 Save and Share Data 317
- Page 319 and 320:
Chapter 10 Save and Share Data 319
- Page 321 and 322:
Chapter 10 Save and Share Data 321
- Page 323 and 324:
Chapter 10 Save and Share Data 323
- Page 325 and 326:
Chapter 10 Save and Share Data 325
- Page 327 and 328:
Chapter 10 Save and Share Data 327
- Page 329 and 330:
Chapter 10 Save and Share Data 329
- Page 331 and 332:
Chapter 10 Save and Share Data 331
- Page 333 and 334:
Chapter 10 Save and Share Data 333
- Page 335 and 336:
Chapter 10 Save and Share Data 335
- Page 337 and 338:
Chapter 10 Save and Share Data 337
- Page 339 and 340:
Chapter 10 Save and Share Data 339
- Page 341 and 342:
Chapter 11 Personalize JMP Customiz
- Page 343 and 344:
Chapter 11 Personalize JMP 343 Pers
- Page 345 and 346:
Chapter 11 Personalize JMP 345 Pers
- Page 347 and 348:
Chapter 11 Personalize JMP 347 Pers
- Page 349 and 350:
Chapter 11 Personalize JMP 349 Pers
- Page 351 and 352:
Chapter 11 Personalize JMP 351 Pers
- Page 353 and 354:
Chapter 11 Personalize JMP 353 Pers
- Page 355 and 356:
Chapter 11 Personalize JMP 355 Pers
- Page 357 and 358:
Chapter 11 Personalize JMP 357 Pers
- Page 359 and 360:
Chapter 11 Personalize JMP 359 Pers
- Page 361 and 362:
Chapter 11 Personalize JMP 361 JMP
- Page 363 and 364:
Chapter A JMP Preferences The Prefe
- Page 365 and 366:
Appendix A JMP Preferences 365 Over
- Page 367 and 368:
Appendix A JMP Preferences 367 Gene
- Page 369 and 370:
Appendix A JMP Preferences 369 Repo
- Page 371 and 372:
Appendix A JMP Preferences 371 Grap
- Page 373 and 374:
Appendix A JMP Preferences 373 Tabl
- Page 375 and 376:
Appendix A JMP Preferences 375 Plat
- Page 377 and 378:
Appendix A JMP Preferences 377 Text
- Page 379 and 380:
Appendix A JMP Preferences 379 Wind
- Page 381 and 382:
Appendix A JMP Preferences 381 Wind
- Page 383 and 384:
Appendix A JMP Preferences 383 Font
- Page 385 and 386:
Appendix A JMP Preferences 385 Comm
- Page 387 and 388:
Appendix A JMP Preferences 387 Scri
- Page 389 and 390:
Appendix A JMP Preferences 389 SAS
- Page 391 and 392:
Appendix A JMP Preferences 391 JMP
- Page 393 and 394:
Appendix A JMP Preferences 393 Menu
- Page 395 and 396:
Appendix B Formula Functions Refere
- Page 397 and 398:
Appendix B Formula Functions Refere
- Page 399 and 400:
Appendix B Formula Functions Refere
- Page 401 and 402:
Appendix B Formula Functions Refere
- Page 403 and 404:
Appendix B Formula Functions Refere
- Page 405 and 406:
Appendix B Formula Functions Refere
- Page 407 and 408:
Appendix B Formula Functions Refere
- Page 409 and 410:
Appendix B Formula Functions Refere
- Page 411 and 412:
Appendix B Formula Functions Refere
- Page 413 and 414:
Appendix B Formula Functions Refere
- Page 415 and 416:
Appendix B Formula Functions Refere
- Page 417 and 418:
Appendix B Formula Functions Refere
- Page 419 and 420:
Appendix B Formula Functions Refere
- Page 421 and 422:
Appendix B Formula Functions Refere
- Page 423 and 424:
Appendix B Formula Functions Refere
- Page 425 and 426:
Appendix B Formula Functions Refere
- Page 427 and 428:
Appendix B Formula Functions Refere
- Page 429 and 430:
Appendix B Formula Functions Refere
- Page 431 and 432:
Appendix B Formula Functions Refere
- Page 433 and 434:
Appendix B Formula Functions Refere
- Page 435 and 436:
Appendix B Formula Functions Refere
- Page 437 and 438:
Appendix B Formula Functions Refere
- Page 439 and 440:
Appendix B Formula Functions Refere
- Page 441 and 442:
Appendix B Formula Functions Refere
- Page 443 and 444:
Appendix B Formula Functions Refere
- Page 445 and 446:
Index Using JMP Symbols ^. See inse
- Page 447 and 448:
Index 447 Coefficient of Variation
- Page 449 and 450:
Index 449 diamond icon, on a report
- Page 451 and 452:
Index 451 aggregate (SQL) 94 column
- Page 453 and 454:
Index 453 K creating from a report
- Page 455 and 456:
Index 455 Multiple Series Stack 174
- Page 457 and 458:
Index 457 quantile statistics 236 Q
- Page 459 and 460:
Index 459 Search/Find 115 using the
- Page 461 and 462:
Index 461 Trial1.jmp 192-193 Trial2