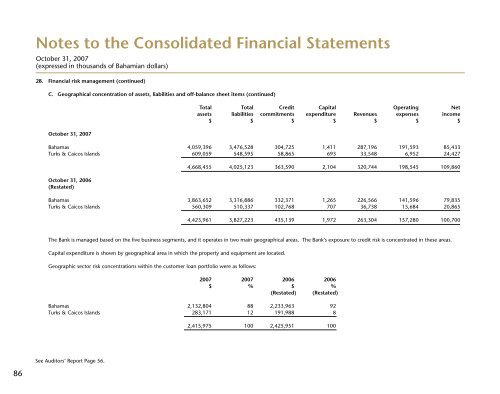
Notes to the Consolidated Financial Statements October 31, 2007 (expressed in thousands of Bahamian dollars) 28. Financial risk management (continued) C. Geographical concentration of assets, liabilities and off-balance sheet items (continued) October 31, 2007 Total Total Credit Capital Operating Net assets liabilities commitments expenditure Revenues expenses income $ $ $ $ $ $ $ <strong>Bahamas</strong> 4,059,396 3,476,528 304,725 1,411 287,196 191,593 85,433 Turks & Caicos Islands 609,059 548,595 58,865 693 33,548 6,952 24,427 October 31, 2006 (Restated) 4,668,455 4,025,123 363,590 2,104 320,744 198,545 109,860 <strong>Bahamas</strong> 3,863,652 3,316,886 332,371 1,265 226,566 141,596 79,835 Turks & Caicos Islands 560,309 510,337 102,768 707 36,738 15,684 20,865 4,423,961 3,827,223 435,139 1,972 263,304 157,280 100,700 The <strong>Bank</strong> is managed based on the five business segments, and it operates in two main geographical areas. The <strong>Bank</strong>’s exposure to credit risk is concentrated in these areas. Capital expenditure is shown by geographical area in which the property and equipment are located. Geographic sector risk concentrations within the customer loan portfolio were as follows: 2007 2007 2006 2006 $ % $ % (Restated) (Restated) <strong>Bahamas</strong> 2,132,804 88 2,233,963 92 Turks & Caicos Islands 283,171 12 191,988 8 2,415,975 100 2,425,951 100 See Auditors’ Report Page 56. 86
Notes to the Consolidated Financial Statements October 31, 2007 (expressed in thousands of Bahamian dollars) 28. Financial risk management (continued) D. Currency risk The <strong>Bank</strong> takes on exposure to effects of fluctuations in the prevailing foreign currency exchange rates on its financial position and cash flows. The Board of Directors sets limits on the level of exposure by currency and in total for both overnight and intra-day positions, which are monitored daily. The table below summarises the <strong>Bank</strong>’s exposure to foreign currency exchange rate risk at October 31. The off-balance sheet net notional position represents the difference between the notional amounts of foreign currency derivative financial instruments, which are principally used to reduce the <strong>Bank</strong>’s exposure to currency movements, and their fair values. Concentrations of assets, liabilities and credit commitments: October 31, 2007 BAH US Other Total $ $ $ $ Assets Cash and balances with central bank 103,199 11,567 2,042 116,808 Due from banks 1,161 48,612 102,853 152,626 Derivative financial instruments — 36,713 — 36,713 Financial assets at fair value through profit or loss — 792,307 — 792,307 Other assets 10,287 20,879 1,496 32,662 Investment securities 133,974 720,623 38,564 893,161 Loans and advances to customers 1,440,983 974,992 — 2,415,975 Property and equipment 20,779 6,094 81 26,954 Retirement benefit assets 11,731 1,771 — 13,502 Goodwill 186,582 1,165 — 187,747 Total assets 1,908,696 2,614,723 145,036 4,668,455 Liabilities Customer deposits 1,348,011 2,064,913 248,482 3,661,406 Derivative financial instruments — 20,940 10,034 30,974 Debt securities in issue 20,620 — — 20,620 Other borrowed funds — 278,171 — 278,171 Other liabilities 280 29,858 — 30,138 Retirement benefit obligations 3,717 — 97 3,814 Total liabilities 1,372,628 2,393,882 258,613 4,025,123 Net on balance sheet position 536,068 220,841 (113,577) 643,332 Credit commitments 104,967 257,062 1,561 363,590 See Auditors’ Report Page 56. Concentrations of assets, liabilities and credit commitments (continued) BAH US Other Total $ $ $ $ October 31, 2006 (Restated) Total assets 1,857,111 2,452,370 114,480 4,423,961 Total liabilities 1,336,948 2,274,672 215,603 3,827,223 Net on balance sheet position 520,163 177,698 (101,123) 596,738 Credit commitments 174,841 258,395 1,903 435,139 E. Cash flow and fair value interest rate risk Cash flow interest rate risk is the risk that the future cash flows of a financial instrument will fluctuate because of changes in market interest rates. Fair value interest rate risk is the risk that the value of a financial instrument will fluctuate because of changes in market interest rates. The <strong>Bank</strong> takes on exposure to the effects of fluctuations in the prevailing levels of market interest rates on both its fair value and cash flow risks. Interest margins may increase as a result of such changes but may reduce or create losses in the event that unexpected movements arise. Limits are set on the level of mismatch of interest rate repricing that may be undertaken, which are monitored on an ongoing basis. Expected repricing and maturity dates do not differ significantly from the contract dates, except for the maturity of deposits up to 1 month, which represent balances on current accounts considered by the <strong>Bank</strong> as a relatively stable core source of funding of its operations. F. Liquidity risk The <strong>Bank</strong> is exposed to daily calls on its available cash resources from overnight deposits, current accounts, maturing deposits, loan draw downs, guarantees and from margin and other calls on cash settled derivatives. The <strong>Bank</strong> does not maintain cash resources to meet all of these needs as experience shows that a minimum level of reinvestment of maturing funds can be predicted with a high level of certainty. The Board sets limits on the minimum proportion of maturing funds available to meet such calls and on the minimum level of interbank and other borrowing facilities that should be in place to cover withdrawals at unexpected levels of demand. The table below analyses assets, liabilities and credit commitments of the <strong>Bank</strong> into relevant maturity groupings based on the remaining period at balance sheet date to the contractual maturity date. 87