ICT and e-business in the tourism industry ICT adoption ... - empirica
ICT and e-business in the tourism industry ICT adoption ... - empirica
ICT and e-business in the tourism industry ICT adoption ... - empirica

You also want an ePaper? Increase the reach of your titles
YUMPU automatically turns print PDFs into web optimized ePapers that Google loves.
Tourism<br />
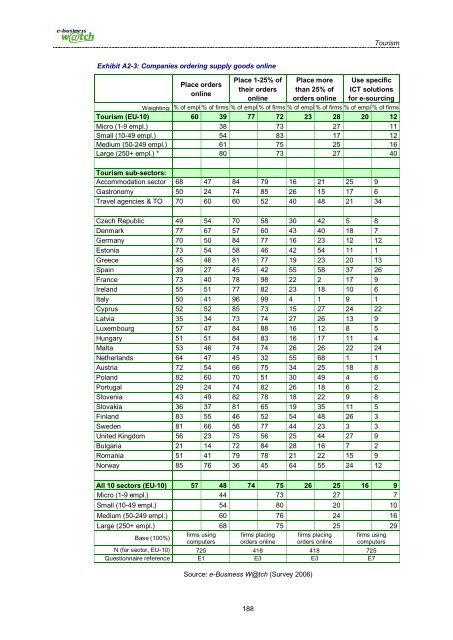
Exhibit A2-3: Companies order<strong>in</strong>g supply goods onl<strong>in</strong>e<br />
Place orders<br />
onl<strong>in</strong>e<br />
Place 1-25% of<br />
<strong>the</strong>ir orders<br />
onl<strong>in</strong>e<br />
Place more<br />
than 25% of<br />
orders onl<strong>in</strong>e<br />
Use specific<br />
<strong>ICT</strong> solutions<br />
for e-sourc<strong>in</strong>g<br />
Weight<strong>in</strong>g: % of empl % of firms % of empl % of firms % of empl % of firms % of empl % of firms<br />
Tourism (EU-10) 60 39 77 72 23 28 20 12<br />
Micro (1-9 empl.) 38 73 27 11<br />
Small (10-49 empl.) 54 83 17 12<br />
Medium (50-249 empl.) 61 75 25 16<br />
Large (250+ empl.) * 80 73 27 40<br />
Tourism sub-sectors:<br />
Accommodation sector 68 47 84 79 16 21 25 9<br />
Gastronomy 50 24 74 85 26 15 17 6<br />
Travel agencies & TO 70 60 60 52 40 48 21 34<br />
Czech Republic 49 54 70 58 30 42 5 8<br />
Denmark 77 67 57 60 43 40 18 7<br />
Germany 70 50 84 77 16 23 12 12<br />
Estonia 73 54 58 46 42 54 11 1<br />
Greece 45 46 81 77 19 23 20 13<br />
Spa<strong>in</strong> 39 27 45 42 55 58 37 26<br />
France 73 40 78 98 22 2 17 9<br />
Irel<strong>and</strong> 55 51 77 82 23 18 10 6<br />
Italy 50 41 96 99 4 1 9 1<br />
Cyprus 52 52 85 73 15 27 24 22<br />
Latvia 35 34 73 74 27 26 13 9<br />
Luxembourg 57 47 84 88 16 12 8 5<br />
Hungary 51 51 84 83 16 17 11 4<br />
Malta 53 46 74 74 26 26 22 24<br />
Ne<strong>the</strong>rl<strong>and</strong>s 64 47 45 32 55 68 1 1<br />
Austria 72 54 66 75 34 25 18 8<br />
Pol<strong>and</strong> 82 60 70 51 30 49 4 6<br />
Portugal 29 24 74 82 26 18 6 2<br />
Slovenia 43 49 82 78 18 22 9 8<br />
Slovakia 36 37 81 65 19 35 11 5<br />
F<strong>in</strong>l<strong>and</strong> 83 55 46 52 54 48 26 3<br />
Sweden 81 66 56 77 44 23 3 3<br />
United K<strong>in</strong>gdom 56 23 75 56 25 44 27 9<br />
Bulgaria 21 14 72 84 28 16 7 2<br />
Romania 51 41 79 78 21 22 15 9<br />
Norway 85 76 36 45 64 55 24 12<br />
All 10 sectors (EU-10) 57 48 74 75 26 25 16 9<br />
Micro (1-9 empl.) 44 73 27 7<br />
Small (10-49 empl.) 54 80 20 10<br />
Medium (50-249 empl.) 60 76 24 16<br />
Large (250+ empl.) 68 75 25 29<br />
Base (100%)<br />
firms us<strong>in</strong>g firms plac<strong>in</strong>g firms plac<strong>in</strong>g firms us<strong>in</strong>g<br />
computers orders onl<strong>in</strong>e orders onl<strong>in</strong>e computers<br />
N (for sector, EU-10) 725 418 418 725<br />
Questionnaire reference E1 E3 E3 E7<br />
Source: e-Bus<strong>in</strong>ess W@tch (Survey 2006)<br />
188