ICT and e-business in the tourism industry ICT adoption ... - empirica
ICT and e-business in the tourism industry ICT adoption ... - empirica
ICT and e-business in the tourism industry ICT adoption ... - empirica

Create successful ePaper yourself
Turn your PDF publications into a flip-book with our unique Google optimized e-Paper software.
Tourism<br />
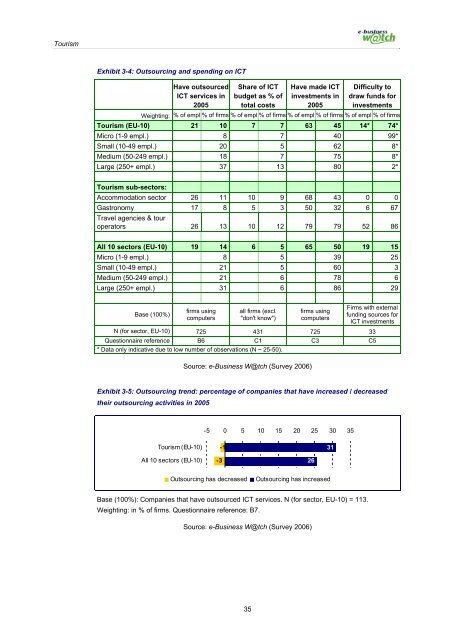
Exhibit 3-4: Outsourc<strong>in</strong>g <strong>and</strong> spend<strong>in</strong>g on <strong>ICT</strong><br />
Have outsourced<br />
<strong>ICT</strong> services <strong>in</strong><br />
2005<br />
Share of <strong>ICT</strong><br />
budget as % of<br />
total costs<br />
Have made <strong>ICT</strong><br />
<strong>in</strong>vestments <strong>in</strong><br />
2005<br />
Difficulty to<br />
draw funds for<br />
<strong>in</strong>vestments<br />
Weight<strong>in</strong>g: % of empl % of firms % of empl % of firms % of empl % of firms % of empl % of firms<br />
Tourism (EU-10) 21 10 7 7 63 45 14* 74*<br />
Micro (1-9 empl.) 8 7 40 99*<br />
Small (10-49 empl.) 20 5 62 8*<br />
Medium (50-249 empl.) 18 7 75 8*<br />
Large (250+ empl.) 37 13 80 2*<br />
Tourism sub-sectors:<br />
Accommodation sector 26 11 10 9 68 43 0 0<br />
Gastronomy 17 8 5 3 50 32 6 67<br />
Travel agencies & tour<br />
operators 26 13 10 12 79 79 52 86<br />
All 10 sectors (EU-10) 19 14 6 5 65 50 19 15<br />
Micro (1-9 empl.) 8 5 39 25<br />
Small (10-49 empl.) 21 5 60 3<br />
Medium (50-249 empl.) 21 6 78 6<br />
Large (250+ empl.) 31 6 86 29<br />
Base (100%)<br />
firms us<strong>in</strong>g<br />
computers<br />
all firms (excl.<br />
"don't know")<br />
firms us<strong>in</strong>g<br />
computers<br />
Firms with external<br />
fund<strong>in</strong>g sources for<br />
<strong>ICT</strong> <strong>in</strong>vestments<br />
N (for sector, EU-10) 725 431 725 33<br />
Questionnaire reference B6 C1 C3 C5<br />
* Data only <strong>in</strong>dicative due to low number of observations (N ~ 25-50).<br />
Source: e-Bus<strong>in</strong>ess W@tch (Survey 2006)<br />
Exhibit 3-5: Outsourc<strong>in</strong>g trend: percentage of companies that have <strong>in</strong>creased / decreased<br />
<strong>the</strong>ir outsourc<strong>in</strong>g activities <strong>in</strong> 2005<br />
-5 0 5 10 15 20 25 30 35<br />
Tourism (EU-10)<br />
All 10 sectors (EU-10)<br />
-1<br />
-3 26<br />
31<br />
Outsourc<strong>in</strong>g has decreased<br />
Outsourc<strong>in</strong>g has <strong>in</strong>creased<br />
Base (100%): Companies that have outsourced <strong>ICT</strong> services. N (for sector, EU-10) = 113.<br />
Weight<strong>in</strong>g: <strong>in</strong> % of firms. Questionnaire reference: B7.<br />
Source: e-Bus<strong>in</strong>ess W@tch (Survey 2006)<br />
35