The Palestinian Economy. Theoretical and Practical Challenges
The Palestinian Economy. Theoretical and Practical Challenges
The Palestinian Economy. Theoretical and Practical Challenges

Create successful ePaper yourself
Turn your PDF publications into a flip-book with our unique Google optimized e-Paper software.
354<br />
Abu-Zaineh – Mataria<br />
substantial part of their working load being cases referred by the MoH (Mataria, Khatib<br />
et al. 2009).<br />
2.1.4. <strong>The</strong> Private for-profit Sector<br />
A wide range of private practices including those of self-employed physicians <strong>and</strong><br />
dentists, hospitals, diagnostic centers, <strong>and</strong> pharmacies represent the “for-profit private”<br />
health care sector. <strong>The</strong> private sector has exp<strong>and</strong>ed rapidly in the past few years, with<br />
phenomena such as group practices <strong>and</strong> private health insurance schemes beginning to<br />
develop. However, the extent to which its practices are monitored <strong>and</strong> regulated, as well<br />
as, the implications of its rapid growth for the public sector remain unclear (Giacaman,<br />
Abdul-Rahim et al. 2003). A comprehensive system of adequate <strong>and</strong> reliable data about<br />
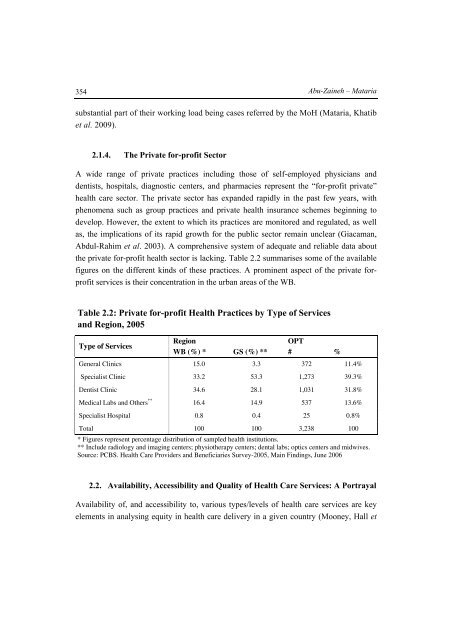
the private for-profit health sector is lacking. Table 2.2 summarises some of the available<br />
figures on the different kinds of these practices. A prominent aspect of the private forprofit<br />
services is their concentration in the urban areas of the WB.<br />
Table 2.2: Private for-profit Health Practices by Type of Services<br />
<strong>and</strong> Region, 2005<br />
Type of Services<br />
Region<br />
OPT<br />
WB (%) * GS (%) ** # %<br />
General Clinics 15.0 3.3 372 11.4%<br />
Specialist Clinic 33.2 53.3 1,273 39.3%<br />
Dentist Clinic 34.6 28.1 1,031 31.8%<br />
Medical Labs <strong>and</strong> Others ** 16.4 14.9 537 13.6%<br />
Specialist Hospital 0.8 0.4 25 0.8%<br />
Total 100 100 3,238 100<br />
* Figures represent percentage distribution of sampled health institutions.<br />
** Include radiology <strong>and</strong> imaging centers; physiotherapy centers; dental labs; optics centers <strong>and</strong> midwives.<br />
Source: PCBS. Health Care Providers <strong>and</strong> Beneficiaries Survey-2005, Main Findings, June 2006<br />
2.2. Availability, Accessibility <strong>and</strong> Quality of Health Care Services: A Portrayal<br />
Availability of, <strong>and</strong> accessibility to, various types/levels of health care services are key<br />
elements in analysing equity in health care delivery in a given country (Mooney, Hall et