The Palestinian Economy. Theoretical and Practical Challenges
The Palestinian Economy. Theoretical and Practical Challenges
The Palestinian Economy. Theoretical and Practical Challenges

Create successful ePaper yourself
Turn your PDF publications into a flip-book with our unique Google optimized e-Paper software.
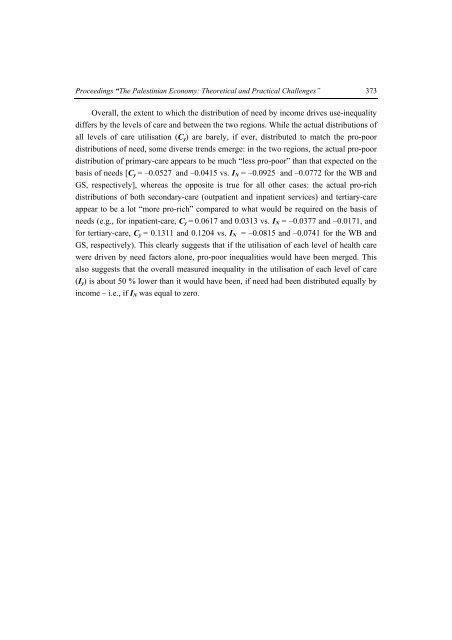
Proceedings “<strong>The</strong> <strong>Palestinian</strong> <strong>Economy</strong>: <strong>The</strong>oretical <strong>and</strong> <strong>Practical</strong> <strong>Challenges</strong>” 373<br />
Overall, the extent to which the distribution of need by income drives use-inequality<br />
differs by the levels of care <strong>and</strong> between the two regions. While the actual distributions of<br />
all levels of care utilisation (C y ) are barely, if ever, distributed to match the pro-poor<br />
distributions of need, some diverse trends emerge: in the two regions, the actual pro-poor<br />
distribution of primary-care appears to be much “less pro-poor” than that expected on the<br />
basis of needs [C y = –0.0527 <strong>and</strong> –0.0415 vs. I N = –0.0925 <strong>and</strong> –0.0772 for the WB <strong>and</strong><br />
GS, respectively], whereas the opposite is true for all other cases: the actual pro-rich<br />
distributions of both secondary-care (outpatient <strong>and</strong> inpatient services) <strong>and</strong> tertiary-care<br />
appear to be a lot “more pro-rich” compared to what would be required on the basis of<br />
needs (e.g., for inpatient-care, C y = 0.0617 <strong>and</strong> 0.0313 vs. I N = –0.0377 <strong>and</strong> –0.0171, <strong>and</strong><br />
for tertiary-care, C y = 0.1311 <strong>and</strong> 0.1204 vs. I N = –0.0815 <strong>and</strong> –0.0741 for the WB <strong>and</strong><br />
GS, respectively). This clearly suggests that if the utilisation of each level of health care<br />
were driven by need factors alone, pro-poor inequalities would have been merged. This<br />
also suggests that the overall measured inequality in the utilisation of each level of care<br />
(I y ) is about 50 % lower than it would have been, if need had been distributed equally by<br />
income – i.e., if I N was equal to zero.