The Palestinian Economy. Theoretical and Practical Challenges
The Palestinian Economy. Theoretical and Practical Challenges
The Palestinian Economy. Theoretical and Practical Challenges

Create successful ePaper yourself
Turn your PDF publications into a flip-book with our unique Google optimized e-Paper software.
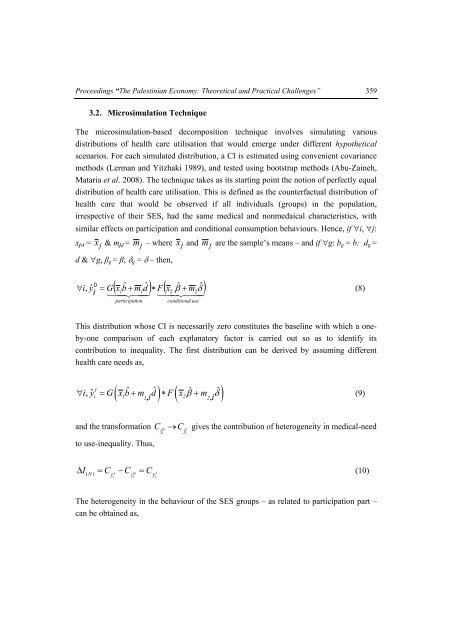
Proceedings “<strong>The</strong> <strong>Palestinian</strong> <strong>Economy</strong>: <strong>The</strong>oretical <strong>and</strong> <strong>Practical</strong> <strong>Challenges</strong>” 359<br />
3.2. Microsimulation Technique<br />
<strong>The</strong> microsimulation-based decomposition technique involves simulating various<br />
distributions of health care utilisation that would emerge under different hypothetical<br />
scenarios. For each simulated distribution, a CI is estimated using convenient covariance<br />
methods (Lerman <strong>and</strong> Yitzhaki 1989), <strong>and</strong> tested using bootstrap methods (Abu-Zaineh,<br />
Mataria et al. 2008). <strong>The</strong> technique takes as its starting point the notion of perfectly equal<br />
distribution of health care utilisation. This is defined as the counterfactual distribution of<br />
health care that would be observed if all individuals (groups) in the population,<br />
irrespective of their SES, had the same medical <strong>and</strong> nonmedaical characteristics, with<br />
similar effects on participation <strong>and</strong> conditional consumption behaviours. Hence, if i, j:<br />
x j , i =<br />
x j & m j,i =<br />
m j – where<br />
d & g, β g = β; g = – then,<br />
x j <strong>and</strong><br />
m j are the sample’s means – <strong>and</strong> if g: b g = b; d g =<br />
i<br />
bˆ<br />
m dˆ<br />
<br />
Fx<br />
ˆ ˆ <br />
0<br />
, yˆ<br />
1 2<br />
m2<br />
i<br />
G x<br />
1<br />
<br />
participation<br />
<br />
conditional use<br />
(8)<br />
This distribution whose CI is necessarily zero constitutes the baseline with which a oneby-one<br />
comparison of each explanatory factor is carried out so as to identify its<br />
contribution to inequality. <strong>The</strong> first distribution can be derived by assuming different<br />
health care needs as,<br />
ˆ ˆ ˆ ˆ<br />
1, i<br />
<br />
2,<br />
i<br />
<br />
1<br />
iy , ˆ Gxbm dF x m<br />
(9)<br />
i 1 2<br />
<strong>and</strong> the transformation C C gives the contribution of heterogeneity in medical-need<br />
ˆ0<br />
to use-inequality. Thus,<br />
y i<br />
1<br />
yˆ<br />
i<br />
I C C C<br />
(10)<br />
( N ) 1 0<br />
1<br />
yˆi yˆi yˆi<br />
<strong>The</strong> heterogeneity in the behaviour of the SES groups – as related to participation part –<br />
can be obtained as,