

Jozani biodiversity inventory report 2002 - Coastal Forests of Kenya ...
Jozani biodiversity inventory report 2002 - Coastal Forests of Kenya ...
Jozani biodiversity inventory report 2002 - Coastal Forests of Kenya ...

Create successful ePaper yourself
Turn your PDF publications into a flip-book with our unique Google optimized e-Paper software.
60<br />
50<br />
53.49<br />
49.06<br />
Basal area (m 2 .ha -1 )<br />
40<br />
30<br />
20<br />
10<br />
0<br />
36.57<br />
22.35<br />
16.30<br />
16.98<br />
17.01<br />
8.43<br />
4.89<br />
0.02<br />
1.20 1.37<br />
4.75 4.09<br />
5.23 6.32 3.29<br />
1 2 3 4 5 6 7 8 9 10 11 12 13 14 15 16 17<br />
Transects<br />
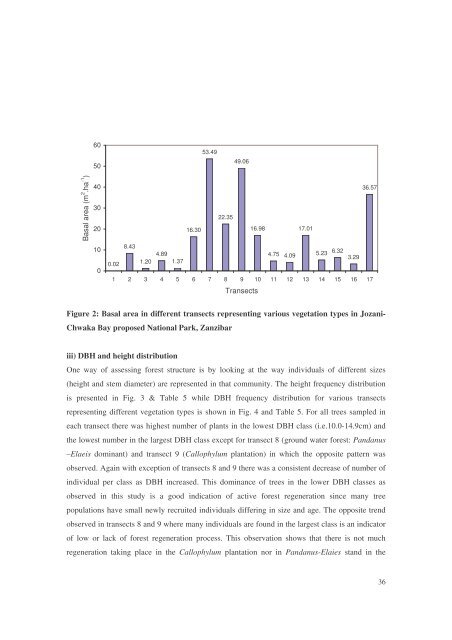
Figure 2: Basal area in different transects representing various vegetation types in <strong>Jozani</strong>-<br />
Chwaka Bay proposed National Park, Zanzibar<br />
iii) DBH and height distribution<br />
One way <strong>of</strong> assessing forest structure is by looking at the way individuals <strong>of</strong> different sizes<br />
(height and stem diameter) are represented in that community. The height frequency distribution<br />
is presented in Fig. 3 & Table 5 while DBH frequency distribution for various transects<br />
representing different vegetation types is shown in Fig. 4 and Table 5. For all trees sampled in<br />
each transect there was highest number <strong>of</strong> plants in the lowest DBH class (i.e.10.0-14.9cm) and<br />
the lowest number in the largest DBH class except for transect 8 (ground water forest: Pandanus<br />
–Elaeis dominant) and transect 9 (Callophylum plantation) in which the opposite pattern was<br />
observed. Again with exception <strong>of</strong> transects 8 and 9 there was a consistent decrease <strong>of</strong> number <strong>of</strong><br />
individual per class as DBH increased. This dominance <strong>of</strong> trees in the lower DBH classes as<br />
observed in this study is a good indication <strong>of</strong> active forest regeneration since many tree<br />
populations have small newly recruited individuals differing in size and age. The opposite trend<br />
observed in transects 8 and 9 where many individuals are found in the largest class is an indicator<br />
<strong>of</strong> low or lack <strong>of</strong> forest regeneration process. This observation shows that there is not much<br />
regeneration taking place in the Callophylum plantation nor in Pandanus-Elaies stand in the<br />
36


