- Page 1 and 2:
SCIENTIFIC PAPERS SERIES A. AGRONOM
- Page 4 and 5:
University of Agronomic Sciences an
- Page 6 and 7:
SUMMARY SOIL SCIENCES Variation of
- Page 8 and 9:
A survey study on determination of
- Page 10 and 11:
Effects of different nitrogen forms
- Page 12 and 13:
Determine the effect of some cultiv
- Page 14:
SOIL SCIENCES
- Page 17 and 18:
K + /Na + ratio that ultimately pre
- Page 19 and 20:
ZINC POLLUTION OF SOILS LOCATED INT
- Page 21 and 22:
as the result of the plant protecti
- Page 23 and 24:
OBTAINING OF HUMATE-BASED LIQUID FE
- Page 25 and 26:
an 11.6% mass loss and a 145.5 J/g
- Page 27 and 28:
mijloc important de fertilizare ech
- Page 29 and 30:
collected on 13/09/2012 at the dept
- Page 31 and 32:
Table 3. The Influence of mineral f
- Page 33 and 34:
CONCLUSIONS The Hybrid rapeseedseed
- Page 35 and 36:
Scientific Papers. Series A. Agrono
- Page 37 and 38:
CONCLUSIONS The results have shown
- Page 39 and 40:
organic carbon was determined thoug
- Page 41 and 42:
THE INFLUENCE OF SOIL TILLING SYSTE
- Page 43 and 44:
emerging plant, we recommend using
- Page 45 and 46:
at the cellular level of Ni (Bou et
- Page 47 and 48:
concentrations in agricultural soil
- Page 49 and 50:
Scientific Papers. Series A. Agrono
- Page 51 and 52:
Surfaces at the bottom shows higher
- Page 53 and 54:
substantial balance that means maxi
- Page 55 and 56:
Table 4. Aggregate composition and
- Page 57 and 58:
Scientific Papers. Series A. Agrono
- Page 59 and 60:
1. The initial parameters of ordina
- Page 61 and 62:
Table 8. Modification of the featur
- Page 63 and 64:
Abstract Scientific Papers. Series
- Page 65 and 66:
the linear correlation coefficient
- Page 67 and 68:
CONCLUSIONS For soil polluted with
- Page 69 and 70:
50 and 100 mg/kg and appreciated th
- Page 71 and 72:
Figure 4. Copper content in soil Fi
- Page 73 and 74:
samples collected in northern of fa
- Page 75 and 76:
MATERIALS AND METHODS Study areas T
- Page 77 and 78:
influenced by heavy metals contamin
- Page 79 and 80:
Pankhurst C.E., 1997. Biodeversity
- Page 81 and 82:
horizons, color, texture, structure
- Page 83 and 84:
From a chemical reaction these soil
- Page 85 and 86:
- Organic matter by Tiurin; - pH (H
- Page 87 and 88:
Abstract Scientific Papers. Series
- Page 89 and 90:
RESULTS AND DISCUSSIONS Invertebrat
- Page 91 and 92:
of moisture in arable layers, incre
- Page 93 and 94:
Abstract Scientific Papers. Series
- Page 95 and 96:
experimentation. The increase of mo
- Page 97 and 98:
THE TRANSITION PERIOD TO THE MARKET
- Page 99 and 100:
Activity data Activity data comes f
- Page 101 and 102:
Figure 2. The decrease of cultivate
- Page 103 and 104:
of nitrous oxide. In: Revised 1996
- Page 105 and 106:
Laboratory results have been interp
- Page 107 and 108:
The air-mass interferes with the ov
- Page 109 and 110:
Under these conditions, Moldavian r
- Page 111 and 112:
decreased to near wilting coefficie
- Page 113 and 114:
CONCLUSIONS Severe drought that aff
- Page 115 and 116:
(temperature and soil moisture, air
- Page 117 and 118:
primary cultures analyzed, hybrids
- Page 119 and 120:
weeding crops during the growing se
- Page 121 and 122:
improper drainage and irrigation (G
- Page 123 and 124:
Figure 4. Scores plot of the soil s
- Page 125 and 126:
Table 1. Cluster analysis of the st
- Page 127 and 128:
DIFFERENTIATION OF FERTILIZATION RA
- Page 129 and 130:
Figure 2. Situation and location of
- Page 131 and 132:
Statistical data processing For the
- Page 133 and 134:
Phosphorus and potassium fertilizer
- Page 135 and 136:
30 m. Regarding the formation and d
- Page 137 and 138:
considerably less. These facts are
- Page 139 and 140:
Table 2. Hydraulic dimensioning Par
- Page 141 and 142:
SPATIAL VARIATION OF PHYSICAL CLAY
- Page 143 and 144:
Figure 2. Situation and location of
- Page 145 and 146:
esistant to high clay content in th
- Page 147 and 148:
CONCLUSIONS Described regularities
- Page 149 and 150:
ecome widespread and in order to ea
- Page 151 and 152:
Table 3. Results of the analysis of
- Page 153 and 154:
COMPARISON OF SYSTEMS FOR TAXONOMY
- Page 155 and 156:
RESULTS AND DISCUSSIONS Soil types
- Page 157 and 158:
underdeveloped cinnamon forest soil
- Page 159 and 160:
Figure 8. Content of skeletal fract
- Page 161 and 162:
MODEL FOR INVESTIGATION, AMELIORATI
- Page 163 and 164:
RESULTS AND DISCUSSIONS Characteris
- Page 165 and 166:
terrain is in the composition of a
- Page 167 and 168:
Such characteristics require the ne
- Page 170 and 171:
Abstract Scientific Papers. Series
- Page 172 and 173:
Australia) with high resolution nit
- Page 174 and 175:
some important medicinal plants of
- Page 176 and 177:
RFV = [120 / NDF] × [88.9 - (0.779
- Page 178 and 179:
Scientific Papers. Series A. Agrono
- Page 180 and 181:
average at Viani - Brila County). A
- Page 182 and 183:
Figure 1. Dry above-ground biomass
- Page 184 and 185:
County) and 30.29% (CERA 270 hybrid
- Page 186 and 187:
Scientific Papers. Series A. Agrono
- Page 188 and 189:
phenological stages were found to h
- Page 190 and 191:
STUDIES REGARDING THE INFLUENCE OF
- Page 192 and 193:
ainfall were able to have a negativ
- Page 194 and 195:
Figure 7. Thermo-hydric stress fact
- Page 196 and 197:
In Romania is grown a large assortm
- Page 198 and 199:
Mainly vitamin C, E and polyphenols
- Page 200 and 201:
soluble compounds with antioxidant
- Page 202 and 203:
primarily the water-soluble antioxi
- Page 204 and 205:
has a split-split-plot design with
- Page 206 and 207:
Kovács B., Gyori Z., Prokisch J.,
- Page 208 and 209:
pays off (Mares et al., 2004; Gonz
- Page 210 and 211:
Table 3. Tested variants V1 Control
- Page 212 and 213:
about the inner value of flora. The
- Page 214 and 215:
MATERIALS AND METHODS Biological ma
- Page 216 and 217:
Figure 2. Correlation between prote
- Page 218 and 219:
CONCLUSIONS Production and quality
- Page 220 and 221:
The following presents several tech
- Page 222 and 223:
3. Evolution of total weed number i
- Page 224 and 225:
RESEARCH ON APPLICATION OF NPK FERT
- Page 226 and 227:
Also increase production significan
- Page 228 and 229:
In April 2012, the pre-sowing proce
- Page 230 and 231:
difference with the hoed control sa
- Page 232 and 233:
RESULTS AND DISCUSSIONS Data about
- Page 234 and 235:
Table 7. Proved difference between
- Page 236 and 237:
Scientific Papers. Series A. Agrono
- Page 238 and 239:
Table 1. Variance analysis experien
- Page 240 and 241:
Amongst the three precocity groups,
- Page 242 and 243:
ACKNOWLEDGEMENTS This study was car
- Page 244 and 245:
to present genetic sources of resis
- Page 246 and 247:
REFERENCES Antonova T.S., Araslanov
- Page 248 and 249:
Halstedii is necessary to identify
- Page 250 and 251:
EFFICIENCY OF UTILIZATION OF ASELEC
- Page 252 and 253:
to separate the effects of genotype
- Page 254 and 255:
INFLUENCE OF THE CLIMATIC CONDITION
- Page 256 and 257:
In 2012, at NARDI Fundulea, data fr
- Page 258 and 259:
parameter from the treated variants
- Page 260 and 261:
Table 6. The effectiveness of some
- Page 262 and 263:
Scientific Papers. Series A. Agrono
- Page 264 and 265:
Table 1. Probability of the meteoro
- Page 266 and 267:
At 50% DI in EOF, only a small part
- Page 268 and 269:
This was probably due to the specif
- Page 270 and 271:
under deficit irrigation. This prov
- Page 272 and 273:
RESULTS AND DISCUSSIONS Intervals w
- Page 274 and 275:
productions from one year to anothe
- Page 276 and 277:
epresented by soil ecologization an
- Page 278 and 279:
new created ones as a basic conditi
- Page 280 and 281:
The highest number of kernels per e
- Page 282 and 283:
Table 8. Average weight of thousand
- Page 284 and 285:
CONCLUSIONS The drought from the ye
- Page 286 and 287:
IWM as appropriate, necessary studi
- Page 288 and 289:
100% in the first 6 weeks of growth
- Page 290 and 291:
Scientific Papers. Series A. Agrono
- Page 292 and 293:
locules boll -1 (0.02), seeds locul
- Page 294 and 295:
Bhutto H., Baloch M.J., Yousaf M.,
- Page 296 and 297:
Table 4. GCA effects for morpho-yie
- Page 298 and 299:
MATERIALS AND METHODS This study wa
- Page 300 and 301:
vegetation of each of the swaths, i
- Page 302 and 303:
Sudangrass hybrids depending on the
- Page 304 and 305:
The parameters of biomass and dry m
- Page 306 and 307:
transplanting and ½ applied at fir
- Page 308 and 309:
Fertilization Forms Table 2. The me
- Page 310 and 311:
growing agricultural farms; evoluti
- Page 312 and 313:
In this area, priority must be to p
- Page 314 and 315:
soybean seeds are found farms that
- Page 316 and 317:
are a better material for haploid i
- Page 318 and 319:
Figure 6. Embryo and endosperm mark
- Page 320 and 321:
RESEARCHES CONCERNING THE INFLUENCE
- Page 322 and 323:
Table 1. The influence of seeding d
- Page 324 and 325:
Exagone hybrid. Thus, when sown at
- Page 326 and 327:
Table 9. The influence of sowing di
- Page 328 and 329:
MATERIALS AND METHODS In order to k
- Page 330 and 331:
Table 3. Genotype influence on whea
- Page 332 and 333:
Romanian varieties from the experim
- Page 334 and 335:
Abstract Scientific Papers. Series
- Page 336 and 337:
Table 2. Efficacy of some fungicide
- Page 338 and 339:
ROMANIAN WHEAT - STRATEGIC PRODUCT
- Page 340 and 341:
exceeded 2,000 thou ha, and maximum
- Page 342 and 343:
Values over 26% wet gluten were det
- Page 344 and 345:
effective and can build a significa
- Page 346 and 347:
grassland. This method is commonly
- Page 348 and 349:
RESULTS REGARDING DROUGHT RESISTANC
- Page 350 and 351:
average for this period is 170.6 mm
- Page 352 and 353:
Hybrid FAO grupe Table 2. The main
- Page 354 and 355:
Abstract Scientific Papers. Series
- Page 356 and 357:
length has lowest values at the unt
- Page 358 and 359:
CHARACTERISTICS OF SECOND GENERATIO
- Page 360 and 361:
developed in Dobrudzha Agricultural
- Page 362 and 363:
Table 5. Cytological characteristic
- Page 364 and 365:
Scientific Papers. Series A. Agrono
- Page 366 and 367:
We can see in the table that all li
- Page 368 and 369:
RESULTS AND DISCUSSIONS Mean compar
- Page 370 and 371:
Scientific Papers. Series A. Agrono
- Page 372 and 373:
Table 4. Statistical interpretation
- Page 374 and 375:
COMPARATIVE STUDY OF CONVENTIONAL A
- Page 376 and 377:
Improved sunflower hybrids for use
- Page 378 and 379:
differences in production to contro
- Page 380 and 381:
International Center for Agricultur
- Page 382 and 383:
Table 3. Evaluation of Genotypes fo
- Page 384 and 385:
Table 1. Characteristics of city sl
- Page 386 and 387:
Scientific Papers. Series A. Agrono
- Page 388 and 389:
Table 4. Amount of the rainfall dur
- Page 390:
ECOLOGICAL AGRICULTURE
- Page 393 and 394:
maize had a density of 5 plants/m 2
- Page 395 and 396:
CONCLUSIONS In terms of productivit
- Page 397 and 398:
amino acids, such as 4-hydroxyisole
- Page 399 and 400:
Scientific Papers. Series A. Agrono
- Page 401 and 402:
Table 5. Determining chlorophyll pi
- Page 403 and 404:
PROPOSALS ON TECHNOLOGY OF MOVING A
- Page 405 and 406:
These are the main technical charac
- Page 407 and 408:
FUNGAL BIODIVERSITY AND CLIMATE CHA
- Page 409 and 410:
Climate change effects and Dobrogea
- Page 411 and 412:
Figure 10. Pure culture of benefici
- Page 413 and 414:
MANAGEMENT OF BENEFICIAL MICROORGAN
- Page 415 and 416:
microorganisms DSMZ Braunschweig -
- Page 417 and 418:
Protocol of research and reporting
- Page 419 and 420:
“HERBAL MEDNET” AN INNOVATIVE A
- Page 421 and 422:
Figure 2. Value of global herbal ma
- Page 423 and 424:
Abstract Scientific Papers. Series
- Page 425 and 426:
Figure 3. The Allelopathy effect on
- Page 428:
AGRICULTURAL ENGINEERING AND RENEWA
- Page 431 and 432:
Research was also aimed at observin
- Page 433 and 434:
Leaf production of dry matter per h
- Page 435 and 436:
cooking oil and jatropha oil (Vonsh
- Page 437 and 438:
machines, many different fat extrac
- Page 439 and 440:
Table 4. The nutrient content Conte
- Page 441 and 442:
Figure 21. Dunaliella salina sp. ch
- Page 443 and 444: for the decline is the growing numb
- Page 445 and 446: Scientific Papers. Series A. Agrono
- Page 447 and 448: Tractor power seemed the obvious wa
- Page 449 and 450: Figure 4 shows that in 17 post war
- Page 451 and 452: their employability, help raise the
- Page 454 and 455: . Scientific Papers. Series A. Agro
- Page 456 and 457: through the sprinkler irrigation. A
- Page 458 and 459: Figure 5. Overlapping sprinklers wi
- Page 460 and 461: CLIMATE CHANGE AND AGROMETEOROLOGIC
- Page 462 and 463: Bulgaria to the use of agroclimatic
- Page 464 and 465: Figure 9. Duration of the period so
- Page 466 and 467: Figure 18. Evapotranspiration of wi
- Page 468 and 469: Scientific Papers. Series A. Agrono
- Page 470 and 471: RESULTS AND DISCUSSIONS After scari
- Page 472 and 473: The influence of the texture on the
- Page 474 and 475: Figure 6. Area of land planted with
- Page 476: APPLIED BIOLOGY IN AGRICULTURAL SCI
- Page 479 and 480: MATERIALS AND METHODS Researches we
- Page 481 and 482: RESEARCHES REGARDING EVOLUTION OF S
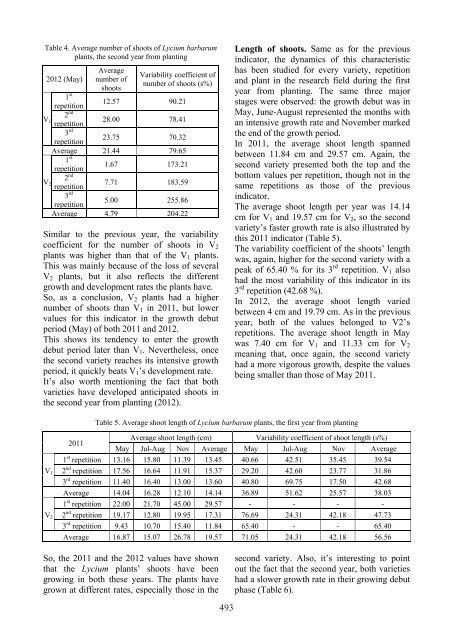
- Page 483 and 484: gradually reduce towards the end of
- Page 485 and 486: Scientific Papers. Series A. Agrono
- Page 487 and 488: According to that, the aspect of th
- Page 489 and 490: etween classes of variation with ma
- Page 491 and 492: Abstract Scientific Papers. Series
- Page 493: Table 2. Average heights of Lycium
- Page 497 and 498: Table 13. Average dry substance of
- Page 499 and 500: Abstract Scientific Papers. Series
- Page 501 and 502: Abstract Scientific Papers. Series
- Page 503 and 504: centrifuge (7000 rev/min. during 20
- Page 505 and 506: 7, Streptomyces sp. 9, and Streptom
- Page 507 and 508: laboratory of Biology, USAMV Buchar
- Page 509 and 510: SOME NEW SPECIMENS FOR ZOOLOGICAL T
- Page 511 and 512: New reptiles for our teaching colle
- Page 514 and 515: Scientific Papers. Series A. Agrono
- Page 516 and 517: Figure 1. Scatter plot of odontosty
- Page 518 and 519: Table 4. Measurements of Xiphinema
- Page 520 and 521: Malus pumila and P. avium are new h
- Page 522 and 523: - the mean, minimum and maximum mon
- Page 524 and 525: The monthly mean of the flow highli
- Page 526 and 527: longer in balance with the existing
- Page 528 and 529: ecording the encountered plant spec
- Page 530 and 531: Mediterranean (3), Balkan (1), Cent
- Page 532 and 533: Table 3. Segetal species of the Top
- Page 534 and 535: Scientific Papers. Series A. Agrono
- Page 536 and 537: of sugar/flower and the honey poten
- Page 538 and 539: Territorial concentration of mellif
- Page 540 and 541: CONCLUSIONS In Giurgiu County there
- Page 542 and 543: farm (Awake, 1998). Rahman et al. 2
- Page 544 and 545:
Table 3 shows that there was a high
- Page 546 and 547:
Abstract Scientific Papers. Series
- Page 548 and 549:
RESULTS AND DISCUSSIONS x, k, r, R
- Page 550 and 551:
Figure 3. Us-Pressure Relations of