Total Quality Management - CII Institute of Logistics
Total Quality Management - CII Institute of Logistics
Total Quality Management - CII Institute of Logistics

Create successful ePaper yourself
Turn your PDF publications into a flip-book with our unique Google optimized e-Paper software.
<strong>Total</strong> <strong>Quality</strong> <strong>Management</strong><br />
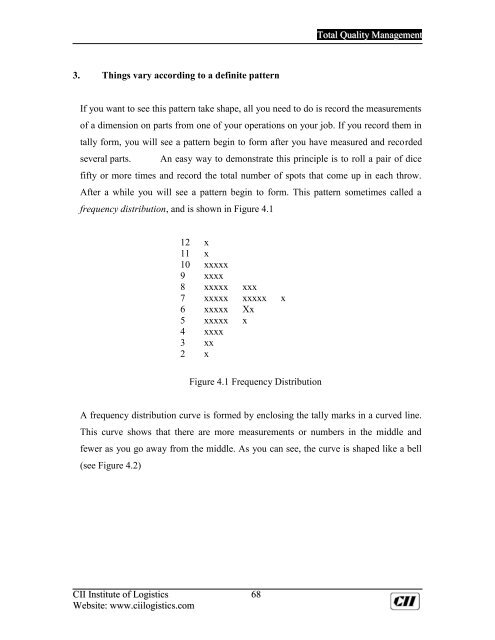
3. Things vary according to a definite pattern<br />
If you want to see this pattern take shape, all you need to do is record the measurements<br />
<strong>of</strong> a dimension on parts from one <strong>of</strong> your operations on your job. If you record them in<br />
tally form, you will see a pattern begin to form after you have measured and recorded<br />
several parts. An easy way to demonstrate this principle is to roll a pair <strong>of</strong> dice<br />
fifty or more times and record the total number <strong>of</strong> spots that come up in each throw.<br />
After a while you will see a pattern begin to form. This pattern sometimes called a<br />
frequency distribution, and is shown in Figure 4.1<br />
12 x<br />
11 x<br />
10 xxxxx<br />
9 xxxx<br />
8 xxxxx xxx<br />
7 xxxxx xxxxx x<br />
6 xxxxx Xx<br />
5 xxxxx x<br />
4 xxxx<br />
3 xx<br />
2 x<br />
Figure 4.1 Frequency Distribution<br />
A frequency distribution curve is formed by enclosing the tally marks in a curved line.<br />
This curve shows that there are more measurements or numbers in the middle and<br />
fewer as you go away from the middle. As you can see, the curve is shaped like a bell<br />
(see Figure 4.2)<br />
<strong>CII</strong> <strong>Institute</strong> <strong>of</strong> <strong>Logistics</strong> 68<br />
Website: www.ciilogistics.com