Total Quality Management - CII Institute of Logistics
Total Quality Management - CII Institute of Logistics
Total Quality Management - CII Institute of Logistics

You also want an ePaper? Increase the reach of your titles
YUMPU automatically turns print PDFs into web optimized ePapers that Google loves.
<strong>Total</strong> <strong>Quality</strong> <strong>Management</strong><br />
small. Here, the theory <strong>of</strong> probability has given us certain results, which are <strong>of</strong> use in the<br />
consideration <strong>of</strong> our decision.<br />
Key Terms used in Sampling Inspection<br />
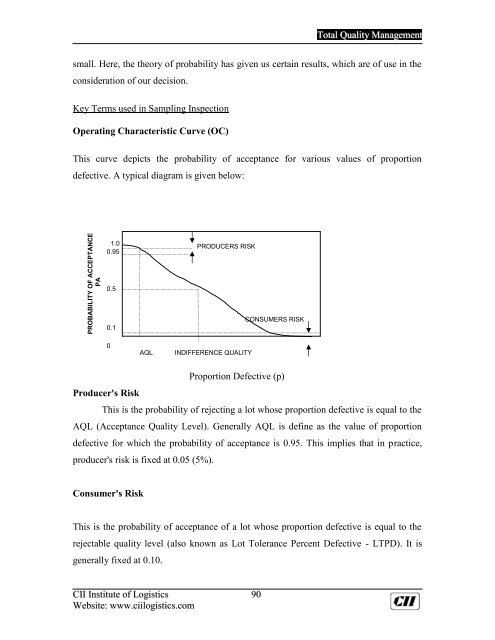
Operating Characteristic Curve (OC)<br />
This curve depicts the probability <strong>of</strong> acceptance for various values <strong>of</strong> proportion<br />
defective. A typical diagram is given below:<br />
PROBABILITY OF ACCEPTANCE<br />
PA<br />
1.0<br />
0.95<br />
0.5<br />
0.1<br />
PRODUCERS RISK<br />
CONSUMERS RISK<br />
0<br />
AQL<br />
INDIFFERENCE QUALITY<br />
Proportion Defective (p)<br />
Producer's Risk<br />
This is the probability <strong>of</strong> rejecting a lot whose proportion defective is equal to the<br />
AQL (Acceptance <strong>Quality</strong> Level). Generally AQL is define as the value <strong>of</strong> proportion<br />
defective for which the probability <strong>of</strong> acceptance is 0.95. This implies that in practice,<br />
producer's risk is fixed at 0.05 (5%).<br />
Consumer's Risk<br />
This is the probability <strong>of</strong> acceptance <strong>of</strong> a lot whose proportion defective is equal to the<br />
rejectable quality level (also known as Lot Tolerance Percent Defective - LTPD). It is<br />
generally fixed at 0.10.<br />
<strong>CII</strong> <strong>Institute</strong> <strong>of</strong> <strong>Logistics</strong> 90<br />
Website: www.ciilogistics.com