Total Quality Management - CII Institute of Logistics
Total Quality Management - CII Institute of Logistics
Total Quality Management - CII Institute of Logistics

Create successful ePaper yourself
Turn your PDF publications into a flip-book with our unique Google optimized e-Paper software.
<strong>Total</strong> <strong>Quality</strong> <strong>Management</strong><br />
SPE<br />
C.<br />
.5623<br />
.5622<br />
.5621<br />
.5620<br />
.5619<br />
.5618<br />
.5617<br />
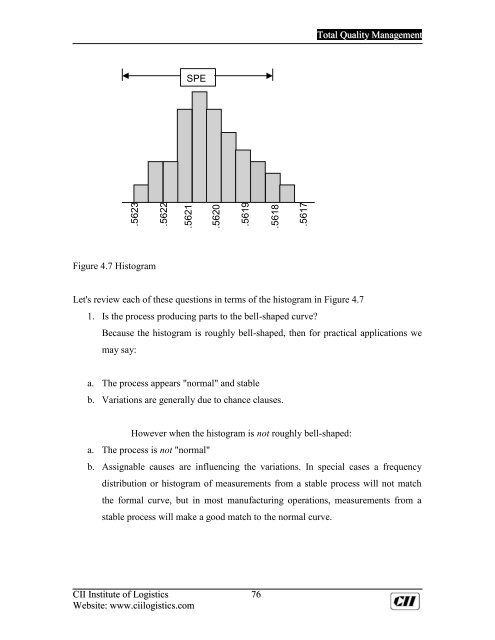
Figure 4.7 Histogram<br />
Let's review each <strong>of</strong> these questions in terms <strong>of</strong> the histogram in Figure 4.7<br />
1. Is the process producing parts to the bell-shaped curve?<br />
Because the histogram is roughly bell-shaped, then for practical applications we<br />
may say:<br />
a. The process appears "normal" and stable<br />
b. Variations are generally due to chance clauses.<br />
However when the histogram is not roughly bell-shaped:<br />
a. The process is not "normal"<br />
b. Assignable causes are influencing the variations. In special cases a frequency<br />
distribution or histogram <strong>of</strong> measurements from a stable process will not match<br />
the formal curve, but in most manufacturing operations, measurements from a<br />
stable process will make a good match to the normal curve.<br />
<strong>CII</strong> <strong>Institute</strong> <strong>of</strong> <strong>Logistics</strong> 76<br />
Website: www.ciilogistics.com