Total Quality Management - CII Institute of Logistics
Total Quality Management - CII Institute of Logistics
Total Quality Management - CII Institute of Logistics

Create successful ePaper yourself
Turn your PDF publications into a flip-book with our unique Google optimized e-Paper software.
<strong>Total</strong> <strong>Quality</strong> <strong>Management</strong><br />
Your goal should be to demonstrate that your job is operating in a stable manner. When<br />
the assignable causes have all been corrected, the variation in your products is due only<br />
to chance causes.<br />
When your operation is stable, then - and only then - can you know with confidence<br />
what your quality level is. When your operation is stable, your productivity and quality<br />
are the best they can be with your process.<br />
Statistical methods <strong>of</strong> quality control give you a way to picture and control quality<br />
through the use <strong>of</strong> these "tools <strong>of</strong> quality".<br />
1. The histogram or frequency distribution<br />
2. The control chart<br />
THE HISTOGRAM OR FREQUENCY DISTRIBUTION<br />
In many families it is a custom to have a picture taken each year. Just as a family<br />
picture is a snapshot <strong>of</strong> a group <strong>of</strong> people, the histogram is a "snapshot" <strong>of</strong> a group <strong>of</strong><br />
parts from a manufacturing operation. It shows how a process is operating at a given<br />
time.<br />
A histogram is simple to construct. It is nothing more than a frequency distribution put<br />
into block form. Let's just say we want a picture <strong>of</strong> the diameters <strong>of</strong> 100 bushings being<br />
machined on a lathe.<br />
By the end <strong>of</strong> our check, the frequency distribution might be as it is shown in Figure<br />
4.6. Putting this distribution into graphic form produces the histogram shown in Figure<br />
4.7. Like the family picture, each histogram has a story to tell.<br />
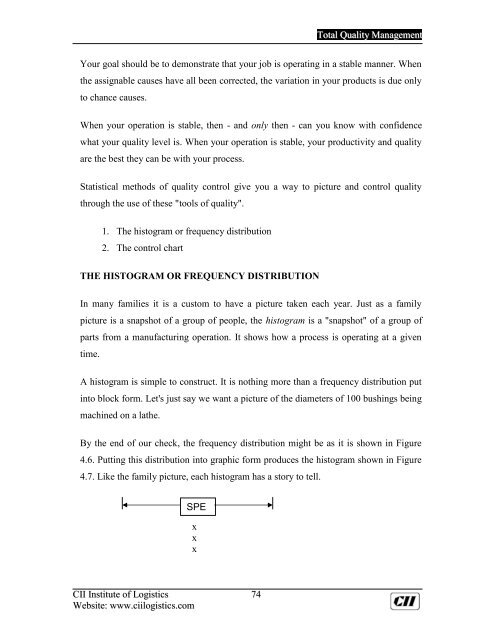
SPE<br />
C.<br />
x<br />
x<br />
x<br />
<strong>CII</strong> <strong>Institute</strong> <strong>of</strong> <strong>Logistics</strong> 74<br />
Website: www.ciilogistics.com