Total Quality Management - CII Institute of Logistics
Total Quality Management - CII Institute of Logistics
Total Quality Management - CII Institute of Logistics

Create successful ePaper yourself
Turn your PDF publications into a flip-book with our unique Google optimized e-Paper software.
<strong>Total</strong> <strong>Quality</strong> <strong>Management</strong><br />
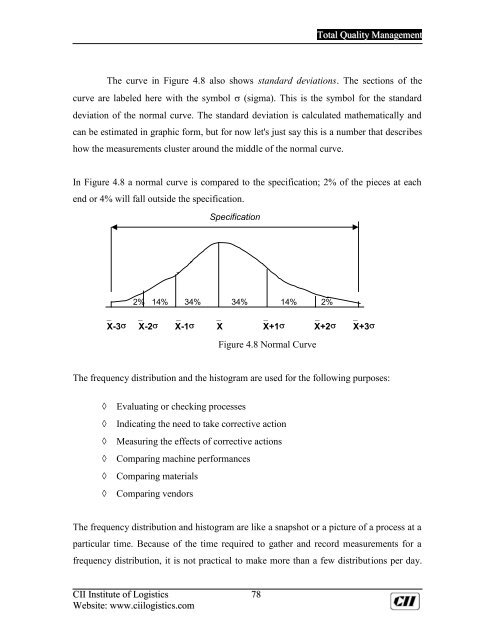
The curve in Figure 4.8 also shows standard deviations. The sections <strong>of</strong> the<br />
curve are labeled here with the symbol (sigma). This is the symbol for the standard<br />
deviation <strong>of</strong> the normal curve. The standard deviation is calculated mathematically and<br />
can be estimated in graphic form, but for now let's just say this is a number that describes<br />
how the measurements cluster around the middle <strong>of</strong> the normal curve.<br />
In Figure 4.8 a normal curve is compared to the specification; 2% <strong>of</strong> the pieces at each<br />
end or 4% will fall outside the specification.<br />
Specification<br />
2% 14% 34% 34% 14% 2%<br />
_ _ _ _ _ _ _<br />
X-3 X-2 X-1 X X+1 X+2 X+3<br />
Figure 4.8 Normal Curve<br />
The frequency distribution and the histogram are used for the following purposes:<br />
<br />
<br />
<br />
<br />
<br />
<br />
Evaluating or checking processes<br />
Indicating the need to take corrective action<br />
Measuring the effects <strong>of</strong> corrective actions<br />
Comparing machine performances<br />
Comparing materials<br />
Comparing vendors<br />
The frequency distribution and histogram are like a snapshot or a picture <strong>of</strong> a process at a<br />
particular time. Because <strong>of</strong> the time required to gather and record measurements for a<br />
frequency distribution, it is not practical to make more than a few distributions per day.<br />
<strong>CII</strong> <strong>Institute</strong> <strong>of</strong> <strong>Logistics</strong> 78<br />
Website: www.ciilogistics.com