Total Quality Management - CII Institute of Logistics
Total Quality Management - CII Institute of Logistics
Total Quality Management - CII Institute of Logistics

Create successful ePaper yourself
Turn your PDF publications into a flip-book with our unique Google optimized e-Paper software.
<strong>Total</strong> <strong>Quality</strong> <strong>Management</strong><br />
20<br />
16<br />
12<br />
8<br />
4<br />
<br />
<br />
<br />
<br />
<br />
<br />
<br />
<br />
UCL<br />
<br />
<br />
<br />
LCL<br />
Date 8/4/<br />
Time<br />
8:05<br />
9:00<br />
9:50<br />
10:30<br />
11:30<br />
11:15<br />
% Defective<br />
1:00<br />
1:40<br />
2:30<br />
3:00<br />
3:30<br />
4:00<br />
5:00<br />
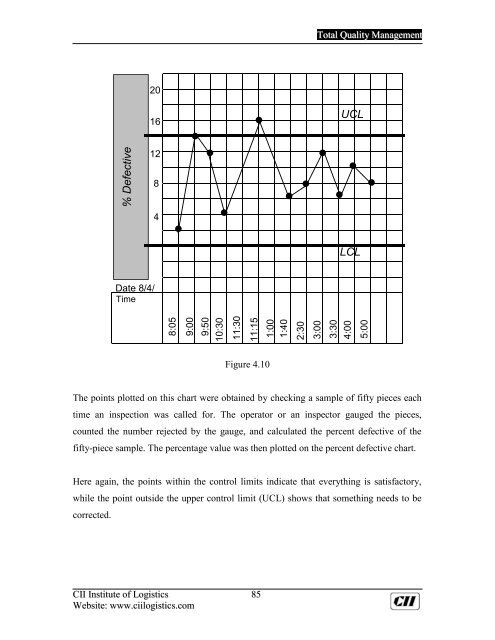
Figure 4.10<br />
The points plotted on this chart were obtained by checking a sample <strong>of</strong> fifty pieces each<br />
time an inspection was called for. The operator or an inspector gauged the pieces,<br />
counted the number rejected by the gauge, and calculated the percent defective <strong>of</strong> the<br />
fifty-piece sample. The percentage value was then plotted on the percent defective chart.<br />
Here again, the points within the control limits indicate that everything is satisfactory,<br />
while the point outside the upper control limit (UCL) shows that something needs to be<br />
corrected.<br />
<strong>CII</strong> <strong>Institute</strong> <strong>of</strong> <strong>Logistics</strong> 85<br />
Website: www.ciilogistics.com