East Kalimantan Environmentally Sustainable Development Strategy
East Kalimantan Environmentally Sustainable Development Strategy
East Kalimantan Environmentally Sustainable Development Strategy

Create successful ePaper yourself
Turn your PDF publications into a flip-book with our unique Google optimized e-Paper software.
21<br />
This resource development pathway has also led to sizeable CO2 emissions, with 250<br />
MtCO2 expected to be emitted in 2010 alone, making <strong>East</strong> <strong>Kalimantan</strong> the third largest<br />
emitter among Indonesia provinces. Sectors accounting for just one-tenth of the province’s<br />
GDP are responsible for 68 percent of all emissions; agriculture, forestry, and palm oil plantations<br />
create the majority of <strong>East</strong> <strong>Kalimantan</strong>’s emissions via deforestation, forest degradation, fires, and<br />
the draining of carbon-rich peatlands. <strong>East</strong> <strong>Kalimantan</strong> stores (or sequesters) a remarkable 4.2<br />
billion tons of carbon (15.4 billion tons of CO2 equivalent) in its forest and peatlands; thus changes<br />
in the use of these lands risks creating emissions far in excess of the sectors typically thought of as<br />
high emitters, such as manufacturing, and oil and gas production and refining.<br />
Emissions will continue to grow under the business-as-usual scenario, reaching an<br />
estimated 303 MtCO2 in 2020 and 331 MtCO2 in 2030, a 32 percent increase in total. It is<br />
true that as the economy develops and moves to higher value added sectors, its carbon intensity<br />
(CO2 output for a given amount of GDP) will decrease. But it is absolute emissions that affect<br />
climate change and these will rise as the palm oil, agriculture, forestry, and coal mining sectors<br />
increase their use of forested land. New power generation and increased transportation will be<br />
significant in terms of emissions growth, but still small when compared to the total emissions.<br />
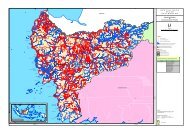
Addressing this development trajectory is complicated by the fact that <strong>East</strong> <strong>Kalimantan</strong>’s<br />
14 districts have significantly different economic and emissions profiles, with three<br />
districts accounting for 55 percent of all provincial CO2 emissions. Kutai Kertanegara,<br />
Kutai Barat and Nunukan make up 55 percent of the provincial emissions, largely due to the<br />
draining of and fires on the approximately 800,000 ha of peatlands in these districts as well as the<br />
combined 60,000 ha of annual deforestation there. The cities of Tarakan, Bontang, Samarinda,<br />
and Balikpapan emit less than 10 percent of total emissions, but their economies are quite<br />
different with Bontang and Balikpapan as major oil and gas centers, and Samarinda and Tarakan<br />
dominated by the service sector (including public administration for Samarinda, the capital).<br />
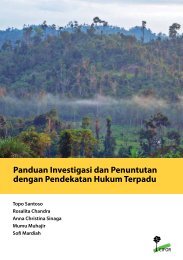
Five sectors are critical for GDP and CO 2 e emissions: Agriculture, palm<br />
oil, forestry, coal, and oil & gas<br />
Percentage<br />
Palm oil/<br />
Estate crops<br />
Agriculture<br />
Forestry<br />
DRAFT<br />
100% =<br />
Coal & Mining<br />
Oil & Gas<br />
103 Trillion IDR<br />
1<br />
4<br />
5<br />
20<br />
46<br />
251 Million Ton CO2e<br />
27<br />
21<br />
20<br />
1.26 Million Workers<br />
2<br />
12<br />
18<br />
6<br />
6<br />
7<br />
3<br />
Exhibit 3<br />
Construction<br />
Manufacturing<br />
Services/Others<br />
2<br />
GDP<br />
2008<br />
19<br />
3<br />
14<br />
8<br />
8<br />
1 2<br />
CO 2<br />
e emissions<br />
2010<br />
45<br />
Employment<br />
2008<br />
SOURCE: BPS Kaltim; Team analysis