East Kalimantan Environmentally Sustainable Development Strategy
East Kalimantan Environmentally Sustainable Development Strategy
East Kalimantan Environmentally Sustainable Development Strategy

You also want an ePaper? Increase the reach of your titles
YUMPU automatically turns print PDFs into web optimized ePapers that Google loves.
28<br />
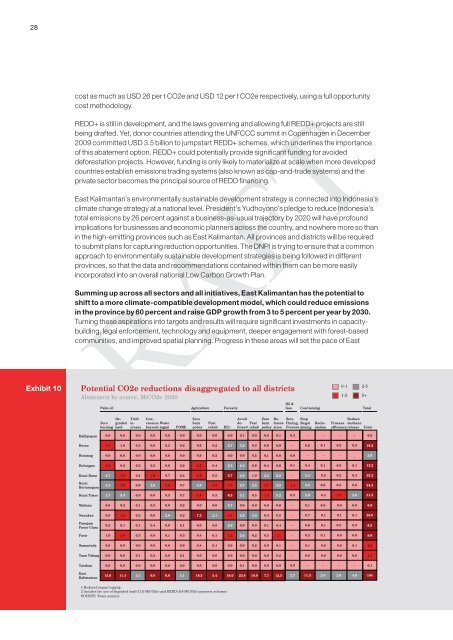
Exhibit 10<br />
cost as much as USD 26 per t CO2e and USD 12 per t CO2e respectively, using a full opportunity<br />
cost methodology.<br />
REDD+ is still in development, and the laws governing and allowing full REDD+ projects are still<br />
being drafted. Yet, donor countries attending the UNFCCC summit in Copenhagen in December<br />
2009 committed USD 3.5 billion to jumpstart REDD+ schemes, which underlines the importance<br />
of this abatement option. REDD+ could potentially provide significant funding for avoided<br />
deforestation projects. However, funding is only likely to materialize at scale when more developed<br />
countries establish emissions trading systems (also known as cap-and-trade systems) and the<br />
private sector becomes the principal source of REDD financing.<br />
<strong>East</strong> <strong>Kalimantan</strong>’s environmentally sustainable development strategy is connected into Indonesia’s<br />
climate change strategy at a national level. President’s Yudhoyono’s pledge to reduce Indonesia’s<br />
total emissions by 26 percent against a business-as-usual trajectory by 2020 will have profound<br />
implications for businesses and economic planners across the country, and nowhere more so than<br />
in the high-emitting provinces such as <strong>East</strong> <strong>Kalimantan</strong>. All provinces and districts will be required<br />
to submit plans for capturing reduction opportunities. The DNPI is trying to ensure that a common<br />
approach to environmentally sustainable development strategies is being followed in different<br />
provinces, so that the data and recommendations contained within them can be more easily<br />
incorporated into an overall national Low Carbon Growth Plan.<br />
Summing up across all sectors and all initiatives, <strong>East</strong> <strong>Kalimantan</strong> has the potential to<br />
shift to a more climate-compatible development model, which could reduce emissions<br />
in the province by 60 percent and raise GDP growth from 3 to 5 percent per year by 2030.<br />
Turning these aspirations into targets and results will require significant investments in capacitybuilding,<br />
legal enforcement, technology and equipment, deeper engagement with forest-based<br />
communities, and improved spatial planning. Progress in these areas will set the pace of <strong>East</strong><br />
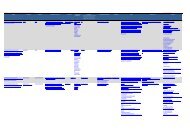
Potential CO2e reductions disaggregated to all districts<br />
Berau<br />
Bontang<br />
Bulungan<br />
DRAFT<br />
Abatement by source, MtCO2e 2030<br />
Balikpapan<br />
Kutai Barat<br />
Kutai<br />
Kertanegara<br />
Kutai Timur<br />
Palm oil<br />
Degraded<br />
in-<br />
Yield<br />
Zero<br />
burning land crease<br />
Concession<br />
Water<br />
buyouts mgmt<br />
0.0 0.0 0.0 0.0 0.0<br />
1.5 1.0 0.3 0.0 0.3<br />
0.0 0.0 0.0 0.0 0.0<br />
1.2 0.2 0.2 0.5 0.6<br />
4.7 1.2 0.4 1.9 0.7<br />
3.4 1.9 0.8 2.6 1.8<br />
2.7 3.4 0.8 0.0 0.3<br />
POME<br />
0.0<br />
0.2<br />
0.0<br />
0.2<br />
0.4<br />
0.7<br />
0.7<br />
Agriculture<br />
Zero<br />
burn<br />
policy<br />
Peat<br />
rehab<br />
0.0 0.0<br />
0.6 0.2<br />
0.9 0.3<br />
1.5 0.4<br />
1.9<br />
0.5<br />
4.6 1.3<br />
1.0 0.3<br />
Forestry<br />
RIL 1<br />
0.0<br />
4.7<br />
0.0<br />
2.5<br />
0.1 0.0 0.0 0.1<br />
3.9<br />
2.4<br />
8.7 4.0 1.0 2.3 2.0<br />
1.8<br />
6.3<br />
2.7<br />
3.1<br />
0.3<br />
0.8<br />
2.5<br />
0.5<br />
0.8<br />
0.4<br />
1.7<br />
1.4<br />
0.9<br />
0.0 0.5 0.1 0.0<br />
0.6<br />
2.8<br />
3.2<br />
Oil &<br />
Gas<br />
0.3<br />
-<br />
0.8<br />
0.1<br />
-<br />
1.4<br />
0.2<br />
Coal mining<br />
Avoid Zero Re-<br />
Zero Stop<br />
deforest<br />
2 rehab policy ation Process mining<br />
Peat burn forest-<br />
Flaring, illegal Reclamation<br />
-<br />
0.67 0.9<br />
-<br />
0.34 0.4<br />
1.90 2.4<br />
2.41 3.0<br />
1.39 2.9<br />
-<br />
0.16<br />
-<br />
0.08 0.1<br />
0.46 0.5<br />
0.58 0.6<br />
0.34 0.4<br />
0-1<br />
1-2<br />
2-5<br />
5+<br />
Reduce<br />
Process methane<br />
efficiencyrelease<br />
Total<br />
-<br />
0.05 0.2<br />
-<br />
0.03<br />
0.14 0.2<br />
0.18 0.3<br />
0.10 1.5<br />
-<br />
0.09 0.3<br />
-<br />
0.05 0.1<br />
0.26 0.4<br />
0.33 0.6<br />
0.19 2.8<br />
Total<br />
0.5<br />
16.2<br />
2.6<br />
12.2<br />
33.2<br />
34.5<br />
31.5<br />
Malinau<br />
0.0 0.2 0.1 0.3 0.0<br />
0.2<br />
0.0 0.0<br />
4.7<br />
0.6<br />
0.0<br />
0.0<br />
0.6<br />
-<br />
0.04 0.1<br />
0.01<br />
0.00<br />
0.01<br />
6.8<br />
Nunukan<br />
0.8 1.5 0.2 0.0 2.8<br />
0.2<br />
7.2 2.1<br />
1.5<br />
2.8<br />
4.0<br />
0.4<br />
0.5<br />
-<br />
0.56 0.7<br />
0.13<br />
0.04 0.1<br />
0.08 0.1<br />
25.0<br />
Panajam<br />
Paser Utara<br />
0.2 0.1 0.1 0.4 0.0<br />
0.1<br />
0.0 0.0<br />
2.6<br />
0.8<br />
0.0<br />
0.1<br />
0.4<br />
-<br />
0.30 0.6<br />
0.07 0.1<br />
0.02 0.3<br />
0.04 0.5<br />
6.3<br />
Pasir<br />
1.0 1.8 0.3 0.0 0.1<br />
0.3<br />
0.4 0.1<br />
1.2<br />
2.4<br />
0.2<br />
0.5<br />
1.1<br />
-<br />
0.21 0.3<br />
0.05 0.1<br />
0.02<br />
0.03<br />
9.8<br />
Samarinda<br />
0.0 0.0 0.0 0.0 0.0<br />
0.0<br />
0.4 0.1<br />
0.0<br />
0.0<br />
0.2<br />
0.0<br />
0.1<br />
-<br />
0.06 0.1<br />
0.01<br />
0.00<br />
0.01 0.1<br />
1.0<br />
Tana Tidung<br />
0.0 0.0 0.1 0.2 0.0<br />
0.1<br />
0.0 0.0<br />
0.0<br />
0.9<br />
0.0<br />
0.0<br />
0.2<br />
-<br />
0.02<br />
0.00<br />
0.00<br />
0.00<br />
1.5<br />
Tarakan<br />
0.0 0.0 0.0 0.0 0.0<br />
0.0<br />
0.0 0.0<br />
0.0<br />
0.1<br />
0.0<br />
0.0<br />
0.0<br />
0.0<br />
-<br />
-<br />
-<br />
-<br />
0.1<br />
<strong>East</strong><br />
<strong>Kalimantan</strong><br />
15.6 11.4 3.3 6.0 6.8<br />
3.1<br />
18.5 5.4<br />
34.0<br />
23.8 10.0 7.7 12.5<br />
2.7<br />
8.11 11.3<br />
2.01<br />
1.56 2.6<br />
2.90 4.8<br />
184<br />
1 Reduced impact logging<br />
2 Includes the use of degraded land (13.9 MtCO2e) and REDD (9.8 MtCO2e) payment schemes<br />
SOURCE: Team analysis