Deciding the Future: Energy Policy Scenarios to 2050
Deciding the Future: Energy Policy Scenarios to 2050
Deciding the Future: Energy Policy Scenarios to 2050

Create successful ePaper yourself
Turn your PDF publications into a flip-book with our unique Google optimized e-Paper software.
30<br />
<strong>Deciding</strong> <strong>the</strong> <strong>Future</strong>: <strong>Energy</strong> <strong>Policy</strong> <strong>Scenarios</strong> <strong>to</strong> <strong>2050</strong> World <strong>Energy</strong> Council 2007 Results of Analysis<br />
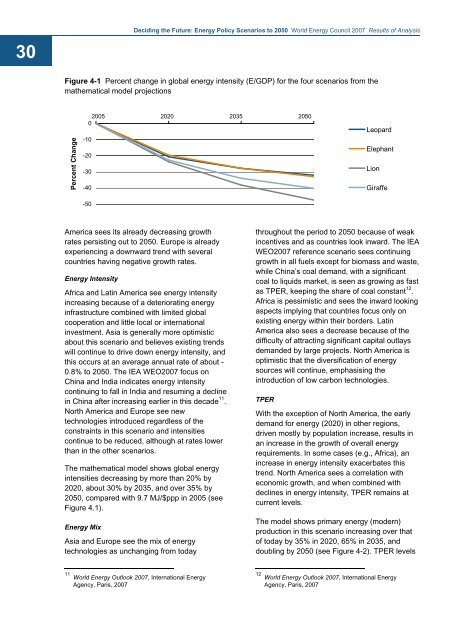
Figure 4-1 Percent change in global energy intensity (E/GDP) for <strong>the</strong> four scenarios from <strong>the</strong><br />
ma<strong>the</strong>matical model projections<br />
Percent Change<br />
2005 2020 2035 <strong>2050</strong><br />
0<br />
-10<br />
-20<br />
-30<br />
-40<br />
-50<br />
Leopard<br />
Elephant<br />
Lion<br />
Giraffe<br />
America sees its already decreasing growth<br />
rates persisting out <strong>to</strong> <strong>2050</strong>. Europe is already<br />
experiencing a downward trend with several<br />
countries having negative growth rates.<br />
<strong>Energy</strong> Intensity<br />
Africa and Latin America see energy intensity<br />
increasing because of a deteriorating energy<br />
infrastructure combined with limited global<br />
cooperation and little local or international<br />
investment. Asia is generally more optimistic<br />
about this scenario and believes existing trends<br />
will continue <strong>to</strong> drive down energy intensity, and<br />
this occurs at an average annual rate of about -<br />
0.8% <strong>to</strong> <strong>2050</strong>. The IEA WEO2007 focus on<br />
China and India indicates energy intensity<br />
continuing <strong>to</strong> fall in India and resuming a decline<br />
in China after increasing earlier in this decade 11 .<br />
North America and Europe see new<br />
technologies introduced regardless of <strong>the</strong><br />
constraints in this scenario and intensities<br />
continue <strong>to</strong> be reduced, although at rates lower<br />
than in <strong>the</strong> o<strong>the</strong>r scenarios.<br />
The ma<strong>the</strong>matical model shows global energy<br />
intensities decreasing by more than 20% by<br />
2020, about 30% by 2035, and over 35% by<br />
<strong>2050</strong>, compared with 9.7 MJ/$ppp in 2005 (see<br />
Figure 4.1).<br />
<strong>Energy</strong> Mix<br />
Asia and Europe see <strong>the</strong> mix of energy<br />
technologies as unchanging from <strong>to</strong>day<br />
throughout <strong>the</strong> period <strong>to</strong> <strong>2050</strong> because of weak<br />
incentives and as countries look inward. The IEA<br />
WEO2007 reference scenario sees continuing<br />
growth in all fuels except for biomass and waste,<br />
while China’s coal demand, with a significant<br />
coal <strong>to</strong> liquids market, is seen as growing as fast<br />
as TPER, keeping <strong>the</strong> share of coal constant 12 .<br />
Africa is pessimistic and sees <strong>the</strong> inward looking<br />
aspects implying that countries focus only on<br />
existing energy within <strong>the</strong>ir borders. Latin<br />
America also sees a decrease because of <strong>the</strong><br />
difficulty of attracting significant capital outlays<br />
demanded by large projects. North America is<br />
optimistic that <strong>the</strong> diversification of energy<br />
sources will continue, emphasising <strong>the</strong><br />
introduction of low carbon technologies.<br />
TPER<br />
With <strong>the</strong> exception of North America, <strong>the</strong> early<br />
demand for energy (2020) in o<strong>the</strong>r regions,<br />
driven mostly by population increase, results in<br />
an increase in <strong>the</strong> growth of overall energy<br />
requirements. In some cases (e.g., Africa), an<br />
increase in energy intensity exacerbates this<br />
trend. North America sees a correlation with<br />
economic growth, and when combined with<br />
declines in energy intensity, TPER remains at<br />
current levels.<br />
The model shows primary energy (modern)<br />
production in this scenario increasing over that<br />
of <strong>to</strong>day by 35% in 2020, 65% in 2035, and<br />
doubling by <strong>2050</strong> (see Figure 4-2). TPER levels<br />
11 World <strong>Energy</strong> Outlook 2007, International <strong>Energy</strong><br />
Agency, Paris, 2007<br />
12 World <strong>Energy</strong> Outlook 2007, International <strong>Energy</strong><br />
Agency, Paris, 2007