Deciding the Future: Energy Policy Scenarios to 2050
Deciding the Future: Energy Policy Scenarios to 2050
Deciding the Future: Energy Policy Scenarios to 2050

You also want an ePaper? Increase the reach of your titles
YUMPU automatically turns print PDFs into web optimized ePapers that Google loves.
<strong>Deciding</strong> <strong>the</strong> <strong>Future</strong>: <strong>Energy</strong> <strong>Policy</strong> <strong>Scenarios</strong> <strong>to</strong> <strong>2050</strong> World <strong>Energy</strong> Council 2007 Appendices<br />
95<br />
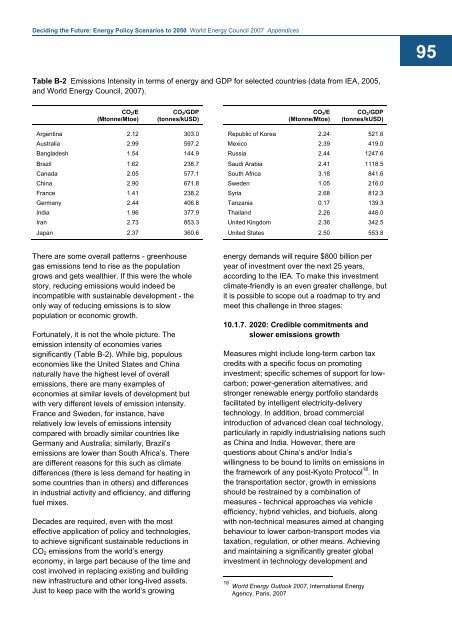
Table B-2 Emissions Intensity in terms of energy and GDP for selected countries (data from IEA, 2005,<br />
and World <strong>Energy</strong> Council, 2007).<br />
CO 2 /E<br />
(M<strong>to</strong>nne/M<strong>to</strong>e)<br />
CO 2 /GDP<br />
(<strong>to</strong>nnes/kUSD)<br />
CO 2 /E<br />
(M<strong>to</strong>nne/M<strong>to</strong>e)<br />
CO 2 /GDP<br />
(<strong>to</strong>nnes/kUSD)<br />
Argentina 2.12 303.0<br />
Australia 2.99 597.2<br />
Bangladesh 1.54 144.9<br />
Brazil 1.62 238.7<br />
Canada 2.05 577.1<br />
China 2.90 671.8<br />
France 1.41 238.2<br />
Germany 2.44 406.8<br />
India 1.96 377.9<br />
Iran 2.73 853.3<br />
Japan 2.37 360.6<br />
Republic of Korea 2.24 521.6<br />
Mexico 2.39 419.0<br />
Russia 2.44 1247.6<br />
Saudi Arabia 2.41 1118.5<br />
South Africa 3.18 841.6<br />
Sweden 1.05 216.0<br />
Syria 2.68 812.3<br />
Tanzania 0.17 139.3<br />
Thailand 2.26 448.0<br />
United Kingdom 2.36 342.5<br />
United States 2.50 553.8<br />
There are some overall patterns - greenhouse<br />
gas emissions tend <strong>to</strong> rise as <strong>the</strong> population<br />
grows and gets wealthier. If this were <strong>the</strong> whole<br />
s<strong>to</strong>ry, reducing emissions would indeed be<br />
incompatible with sustainable development - <strong>the</strong><br />
only way of reducing emissions is <strong>to</strong> slow<br />
population or economic growth.<br />
Fortunately, it is not <strong>the</strong> whole picture. The<br />
emission intensity of economies varies<br />
significantly (Table B-2). While big, populous<br />
economies like <strong>the</strong> United States and China<br />
naturally have <strong>the</strong> highest level of overall<br />
emissions, <strong>the</strong>re are many examples of<br />
economies at similar levels of development but<br />
with very different levels of emission intensity.<br />
France and Sweden, for instance, have<br />
relatively low levels of emissions intensity<br />
compared with broadly similar countries like<br />
Germany and Australia; similarly, Brazil’s<br />
emissions are lower than South Africa’s. There<br />
are different reasons for this such as climate<br />
differences (<strong>the</strong>re is less demand for heating in<br />
some countries than in o<strong>the</strong>rs) and differences<br />
in industrial activity and efficiency, and differing<br />
fuel mixes.<br />
Decades are required, even with <strong>the</strong> most<br />
effective application of policy and technologies,<br />
<strong>to</strong> achieve significant sustainable reductions in<br />
CO 2 emissions from <strong>the</strong> world’s energy<br />
economy, in large part because of <strong>the</strong> time and<br />
cost involved in replacing existing and building<br />
new infrastructure and o<strong>the</strong>r long-lived assets.<br />
Just <strong>to</strong> keep pace with <strong>the</strong> world’s growing<br />
energy demands will require $800 billion per<br />
year of investment over <strong>the</strong> next 25 years,<br />
according <strong>to</strong> <strong>the</strong> IEA. To make this investment<br />
climate-friendly is an even greater challenge, but<br />
it is possible <strong>to</strong> scope out a roadmap <strong>to</strong> try and<br />
meet this challenge in three stages:<br />
10.1.7. 2020: Credible commitments and<br />
slower emissions growth<br />
Measures might include long-term carbon tax<br />
credits with a specific focus on promoting<br />
investment; specific schemes of support for lowcarbon;<br />
power-generation alternatives; and<br />
stronger renewable energy portfolio standards<br />
facilitated by intelligent electricity-delivery<br />
technology. In addition, broad commercial<br />
introduction of advanced clean coal technology,<br />
particularly in rapidly industrialising nations such<br />
as China and India. However, <strong>the</strong>re are<br />
questions about China’s and/or India’s<br />
willingness <strong>to</strong> be bound <strong>to</strong> limits on emissions in<br />
<strong>the</strong> framework of any post-Kyo<strong>to</strong> Pro<strong>to</strong>col 18 . In<br />
<strong>the</strong> transportation sec<strong>to</strong>r, growth in emissions<br />
should be restrained by a combination of<br />
measures - technical approaches via vehicle<br />
efficiency, hybrid vehicles, and biofuels, along<br />
with non-technical measures aimed at changing<br />
behaviour <strong>to</strong> lower carbon-transport modes via<br />
taxation, regulation, or o<strong>the</strong>r means. Achieving<br />
and maintaining a significantly greater global<br />
investment in technology development and<br />
18 World <strong>Energy</strong> Outlook 2007, International <strong>Energy</strong><br />
Agency, Paris, 2007