Download PDF version English (3237KB) - Hamon
Download PDF version English (3237KB) - Hamon
Download PDF version English (3237KB) - Hamon

Create successful ePaper yourself
Turn your PDF publications into a flip-book with our unique Google optimized e-Paper software.
120<br />
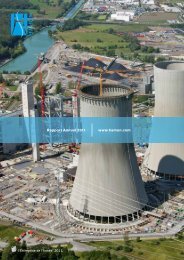
<strong>Hamon</strong> Annual Report 2012<br />
Information on the key performance indicators<br />
Some social indicators require detailed explanations:<br />
Total headcount by job type<br />
As noted in the section on Corporate Social Responsibilities,<br />
these figures are based on:<br />
■ Employees from (1) fully consolidated subsidiaries<br />
and (2) subsidiaries consolidated by proportional<br />
integration, on a pro rata basis of the capital held<br />
by <strong>Hamon</strong>.<br />
■ Full-time equivalent and only staff on open-ended<br />
contracts. In the light of our extensive activities on<br />
worksites, the number of employees on short-term<br />
contracts constantly varies; for some, the length of<br />
the contract is limited to short periods. In some cases,<br />
we use external temporary recruitment agencies.<br />
■ The average for the year. If a subsidiary is only<br />
consolidated for one part of the fiscal year, a pro rata<br />
amount is calculated (for example, if a subsidiary is<br />
only consolidated for six months, the average staff<br />
numbers for this entity over the six months will only<br />
be taken at 50%).<br />
Rate of frequency of occupational accidents by region<br />
(number of accidents / million working hours)<br />
The rate of frequency is the ratio between:<br />
■ The number of occupational accidents (fatal and<br />
non-fatal, including on the way to work).<br />
■ The number of effective hours of work (in million).<br />
Rate of severity of occupational accidents by region<br />
(number of days lost / thousand working hours)<br />
The rate of severity is the ratio between:<br />
■ The number of working days lost because of an<br />
occupational accident.<br />
■ The number of effective hours of work (in thousand).<br />
The number of days lost are working days (not calendar<br />
days). The starting point for the calculation is the day<br />
of the occupational accident or disease, except in some<br />
Asian subsidiaries where the starting point is the day<br />
that exceeds the annual quota for sick leave (and<br />
holiday). If a person has already been on sick leave, it<br />
is the cumulated number of days already accrued for<br />
illness which is taken into account. The annual quota<br />
depends on each of the subsidiaries. This also applies<br />
to the two key indicators below.<br />
Rate of absenteeism<br />
This rate is the ratio between:<br />
■ The number of working days lost due to occupational<br />
accidents, occupational diseases and other illnesses<br />
(flu, etc.) or unexplained absences; maternity leaves<br />
and planned leaves such as holiday and statutory<br />
leave are not included.<br />
■ The theoretical number of working days aside from<br />
statutory leave and holiday.<br />
The other key indicators are more usual; therefore<br />
explanations are given hereunder only when necessary:<br />
a) Economic indicators<br />
■ Direct economic value created and distributed: this<br />
includes the turnover, the gross margin, labor costs,<br />
financial fees paid to banks, paid taxes, dividends paid<br />
out to shareholders, retained profits, donations.<br />
■ Provisions for pensions with defined benefit plans:<br />
see detailed explanation in note 32 of the financial<br />
section, which covers this key indicator.<br />
■ Significant grants and public funding received.<br />
■ Local recruitment practices and proportion of managers<br />
hired locally.<br />
b) Environmental indicators<br />
■ Direct energy consumption by primary energy source.<br />
■ Total volume of water withdrawn, by source.<br />
■ Initiatives to reduce the environmental impact of<br />
products and services.<br />
c) Other social indicators<br />
■ Average number of hours of training per year.<br />
■ Activities identified as presenting a significant risk of<br />
accidents involving children and the measures taken.<br />
■ Total number of legal actions related to anti-competitive<br />
behavior, antitrust laws and monopolistic practices;<br />
outcome of these legal actions.<br />
The GRI correspondence grid which follows shows<br />
where to find each of these key performance indicators<br />
in the annual report.<br />
Rate of occupational disease by region (number of days<br />
lost / thousand working hours)<br />
The rate is the ratio between:<br />
■ The number of working days lost due to occupational<br />
diseases (depression, inhaling of toxic gases, etc.).<br />
■ Number of effective hours of work (in thousand).