Download PDF version English (3237KB) - Hamon
Download PDF version English (3237KB) - Hamon
Download PDF version English (3237KB) - Hamon

Create successful ePaper yourself
Turn your PDF publications into a flip-book with our unique Google optimized e-Paper software.
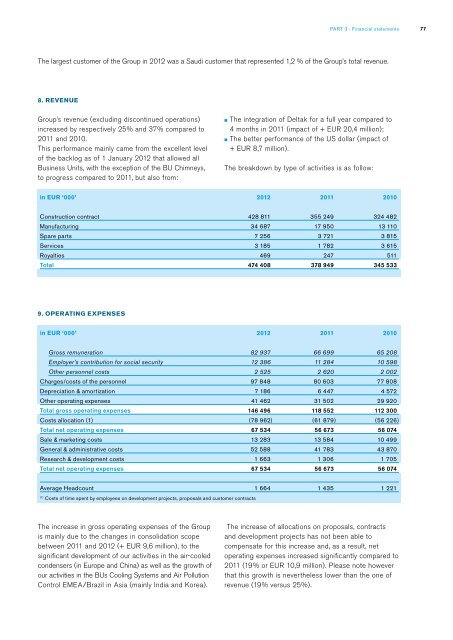
Part 3 - Financial statements<br />
77<br />
The largest customer of the Group in 2012 was a Saudi customer that represented 1,2 % of the Group’s total revenue.<br />
8. Revenue<br />
Group’s revenue (excluding discontinued operations)<br />
increased by respectively 25% and 37% compared to<br />
2011 and 2010.<br />
This performance mainly came from the excellent level<br />
of the backlog as of 1 January 2012 that allowed all<br />
Business Units, with the exception of the BU Chimneys,<br />
to progress compared to 2011, but also from:<br />
■ The integration of Deltak for a full year compared to<br />
4 months in 2011 (impact of + EUR 20,4 million);<br />
■ The better performance of the US dollar (impact of<br />
+ EUR 8,7 million).<br />
The breakdown by type of activities is as follow:<br />
in EUR ‘000’<br />
2012 2011 2010<br />
Construction contract<br />
Manufacturing<br />
Spare parts<br />
Services<br />
Royalties<br />
Total<br />
428 811 355 249 324 482<br />
34 687 17 950 13 110<br />
7 256 3 721 3 815<br />
3 185 1 782 3 615<br />
469 247 511<br />
474 408 378 949 345 533<br />
9. Operating expenses<br />
in EUR ‘000’<br />
2012 2011 2010<br />
Gross remuneration<br />
Employer’s contribution for social security<br />
Other personnel costs<br />
Charges/costs of the personnel<br />
Depreciation & amortization<br />
Other operating expenses<br />
Total gross operating expenses<br />
Costs allocation (1)<br />
Total net operating expenses<br />
Sale & marketing costs<br />
General & administrative costs<br />
Research & development costs<br />
Total net operating expenses<br />
82 937 66 699 65 208<br />
12 386 11 284 10 598<br />
2 525 2 620 2 002<br />
97 848 80 603 77 808<br />
7 186 6 447 4 572<br />
41 462 31 502 29 920<br />
146 496 118 552 112 300<br />
(78 962 ) (61 879 ) (56 226 )<br />
67 534 56 673 56 074<br />
13 283 13 584 10 499<br />
52 588 41 783 43 870<br />
1 663 1 306 1 705<br />
67 534 56 673 56 074<br />
Average Headcount<br />
(1)<br />
Costs of time spent by employees on development projects, proposals and customer contracts<br />
1 664 1 435 1 221<br />
The increase in gross operating expenses of the Group<br />
is mainly due to the changes in consolidation scope<br />
between 2011 and 2012 (+ EUR 9,6 million), to the<br />
significant development of our activities in the air-cooled<br />
condensers (in Europe and China) as well as the growth of<br />
our activities in the BUs Cooling Systems and Air Pollution<br />
Control EMEA/Brazil in Asia (mainly India and Korea).<br />
The increase of allocations on proposals, contracts<br />
and development projects has not been able to<br />
compensate for this increase and, as a result, net<br />
operating expenses increased significantly compared to<br />
2011 (19% or EUR 10,9 million). Please note however<br />
that this growth is nevertheless lower than the one of<br />
revenue (19% versus 25%).