Download PDF version English (3237KB) - Hamon
Download PDF version English (3237KB) - Hamon
Download PDF version English (3237KB) - Hamon

You also want an ePaper? Increase the reach of your titles
YUMPU automatically turns print PDFs into web optimized ePapers that Google loves.
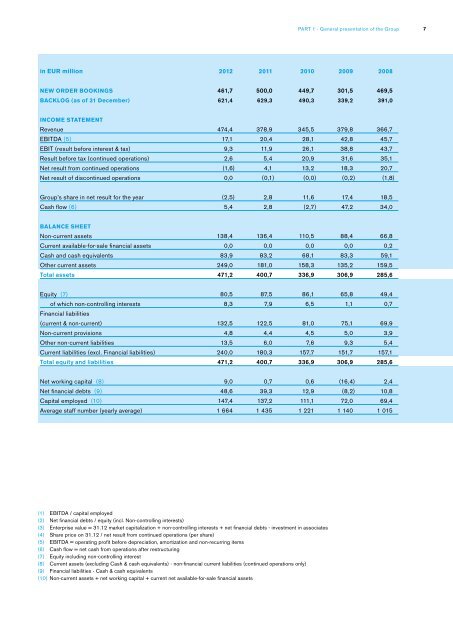
Part 1 - General presentation of the Group<br />
7<br />
in EUR million<br />
2012 2011 2010 2009 2008<br />
NEW ORDER BOOKINGS<br />
Backlog (as of 31 December)<br />
461,7 500,0 449,7 301,5 469,5<br />
621,4 629,3 490,3 339,2 391,0<br />
INCOME STATEMENT<br />
Revenue<br />
EBITDA (5)<br />
EBIT (result before interest & tax)<br />
Result before tax (continued operations)<br />
Net result from continued operations<br />
Net result of discontinued operations<br />
474,4 378,9 345,5 379,8 366,7<br />
17,1 20,4 28,1 42,8 45,7<br />
9,3 11,9 26,1 38,8 43,7<br />
2,6 5,4 20,9 31,6 35,1<br />
(1,6) 4,1 13,2 18,3 20,7<br />
0,0 (0,1) (0,0) (0,2) (1,8)<br />
Group’s share in net result for the year<br />
Cash flow (6)<br />
(2,5 ) 2,8 11,6 17,4 18,5<br />
5,4 2,8 (2,7 ) 47,2 34,0<br />
BALANCE SHEET<br />
Non-current assets<br />
Current available-for-sale financial assets<br />
Cash and cash equivalents<br />
Other current assets<br />
Total assets<br />
138,4 136,4 110,5 88,4 66,8<br />
0,0 0,0 0,0 0,0 0,2<br />
83,9 83,2 68,1 83,3 59,1<br />
249,0 181,0 158,3 135,2 159,5<br />
471,2 400,7 336,9 306,9 285,6<br />
Equity (7)<br />
of which non-controlling interests<br />
Financial liabilities<br />
(current & non-current)<br />
Non-current provisions<br />
Other non-current liabilities<br />
Current liabilities (excl. Financial liabilities)<br />
Total equity and liabilities<br />
80,5 87,5 86,1 65,8 49,4<br />
8,3 7,9 6,5 1,1 0,7<br />
132,5 122,5 81,0 75,1 69,9<br />
4,8 4,4 4,5 5,0 3,9<br />
13,5 6,0 7,6 9,3 5,4<br />
240,0 180,3 157,7 151,7 157,1<br />
471,2 400,7 336,9 306,9 285,6<br />
Net working capital (8)<br />
Net financial debts (9)<br />
Capital employed (10)<br />
Average staff number (yearly average)<br />
9,0 0,7 0,6 (16,4) 2,4<br />
48,6 39,3 12,9 (8,2) 10,8<br />
147,4 137,2 111,1 72,0 69,4<br />
1 664 1 435 1 221 1 140 1 015<br />
(1) EBITDA / capital employed<br />
(2) Net financial debts / equity (incl. Non-controlling interests)<br />
(3) Enterprise value = 31.12 market capitalization + non-controlling interests + net financial debts - investment in associates<br />
(4) Share price on 31.12 / net result from continued operations (per share)<br />
(5) EBITDA = operating profit before depreciation, amortization and non-recurring items<br />
(6) Cash flow = net cash from operations after restructuring<br />
(7) Equity including non-controlling interest<br />
(8) Current assets (excluding Cash & cash equivalents) - non-financial current liabilities (continued operations only)<br />
(9) Financial liabilities - Cash & cash equivalents<br />
(10) Non-current assets + net working capital + current net available-for-sale financial assets