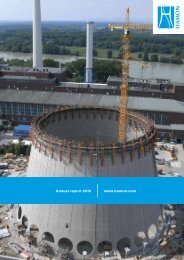
Download PDF version English (3237KB) - Hamon
Download PDF version English (3237KB) - Hamon
Download PDF version English (3237KB) - Hamon

Create successful ePaper yourself
Turn your PDF publications into a flip-book with our unique Google optimized e-Paper software.
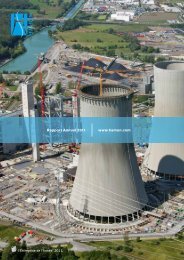
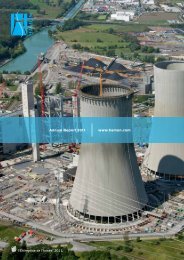
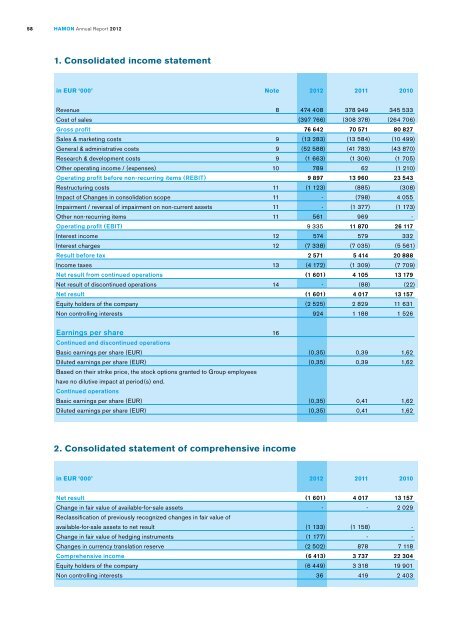
58<br />
<strong>Hamon</strong> Annual Report 2012<br />
1. Consolidated income statement<br />
in EUR ‘000’<br />
note 2012 2011 2010<br />
Revenue<br />
Cost of sales<br />
Gross profit<br />
Sales & marketing costs<br />
General & administrative costs<br />
Research & development costs<br />
Other operating income / (expenses)<br />
Operating profit before non-recurring items (REBIT)<br />
Restructuring costs<br />
Impact of Changes in consolidation scope<br />
Impairment / reversal of impairment on non-current assets<br />
Other non-recurring items<br />
Operating profit (EBIT)<br />
Interest income<br />
Interest charges<br />
Result before tax<br />
Income taxes<br />
Net result from continued operations<br />
Net result of discontinued operations<br />
Net result<br />
Equity holders of the company<br />
Non controlling interests<br />
8 474 408 378 949 345 533<br />
(397 766 ) (308 378 ) (264 706 )<br />
76 642 70 571 80 827<br />
9 (13 283 ) (13 584 ) (10 499 )<br />
9 (52 588 ) (41 783 ) (43 870 )<br />
9 (1 663 ) (1 306 ) (1 705 )<br />
10 789 62 (1 210 )<br />
9 897 13 960 23 543<br />
11 (1 123 ) (885) (308)<br />
11 - (798) 4 055<br />
11 - (1 377 ) (1 173 )<br />
11 561 969 -<br />
9 335 11 870 26 117<br />
12 574 579 332<br />
12 (7 338 ) (7 035 ) (5 561 )<br />
2 571 5 414 20 888<br />
13 (4 172 ) (1 309 ) (7 709 )<br />
(1 601 ) 4 105 13 179<br />
14 - (88) (22)<br />
(1 601 ) 4 017 13 157<br />
(2 525 ) 2 829 11 631<br />
924 1 188 1 526<br />
Earnings per share<br />
Continued and discontinued operations<br />
Basic earnings per share (EUR)<br />
Diluted earnings per share (EUR)<br />
Based on their strike price, the stock options granted to Group employees<br />
have no dilutive impact at period(s) end.<br />
Continued operations<br />
Basic earnings per share (EUR)<br />
Diluted earnings per share (EUR)<br />
16<br />
(0,35) 0,39 1,62<br />
(0,35) 0,39 1,62<br />
(0,35) 0,41 1,62<br />
(0,35) 0,41 1,62<br />
2. Consolidated statement of comprehensive income<br />
in EUR ‘000’<br />
2012 2011 2010<br />
Net result<br />
Change in fair value of available-for-sale assets<br />
Reclassification of previously recognized changes in fair value of<br />
available-for-sale assets to net result<br />
Change in fair value of hedging instruments<br />
Changes in currency translation reserve<br />
Comprehensive income<br />
Equity holders of the company<br />
Non controlling interests<br />
(1 601 ) 4 017 13 157<br />
- - 2 029<br />
(1 133 ) (1 158 ) -<br />
(1 177 ) - -<br />
(2 502 ) 878 7 118<br />
(6 413 ) 3 737 22 304<br />
(6 449 ) 3 318 19 901<br />
36 419 2 403