Download PDF version English (3237KB) - Hamon
Download PDF version English (3237KB) - Hamon
Download PDF version English (3237KB) - Hamon

You also want an ePaper? Increase the reach of your titles
YUMPU automatically turns print PDFs into web optimized ePapers that Google loves.
Part 1 - General presentation of the Group<br />
19<br />
Members of staff included for each subsidiary within<br />
the area studied are the same as those taken into<br />
account in the calculation of Group workforce (see<br />
Headcount section).<br />
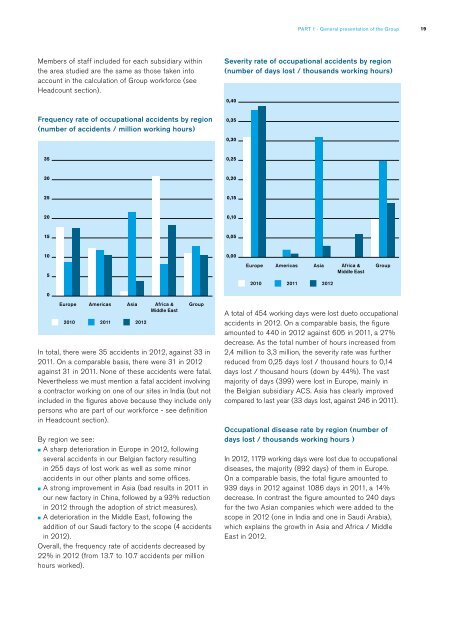
Frequency rate of occupational accidents by region<br />
(number of accidents / million working hours)<br />
Severity rate of occupational accidents by region<br />
(number of days lost / thousands working hours)<br />
0,40<br />
0,35<br />
0,30<br />
35<br />
0,25<br />
30<br />
0,20<br />
25<br />
0,15<br />
20<br />
0,10<br />
15<br />
0,05<br />
10<br />
0,00<br />
5<br />
Europe<br />
Americas<br />
2010 2011<br />
Asia<br />
2012<br />
Africa &<br />
Middle East<br />
Group<br />
0<br />
Europe Americas Asia<br />
2010 2011<br />
2012<br />
Africa &<br />
Middle East<br />
Group<br />
In total, there were 35 accidents in 2012, against 33 in<br />
2011. On a comparable basis, there were 31 in 2012<br />
against 31 in 2011. None of these accidents were fatal.<br />
Nevertheless we must mention a fatal accident involving<br />
a contractor working on one of our sites in India (but not<br />
included in the figures above because they include only<br />
persons who are part of our workforce - see definition<br />
in Headcount section).<br />
By region we see:<br />
■ A sharp deterioration in Europe in 2012, following<br />
several accidents in our Belgian factory resulting<br />
in 255 days of lost work as well as some minor<br />
accidents in our other plants and some offices.<br />
■ A strong improvement in Asia (bad results in 2011 in<br />
our new factory in China, followed by a 93% reduction<br />
in 2012 through the adoption of strict measures).<br />
■ A deterioration in the Middle East, following the<br />
addition of our Saudi factory to the scope (4 accidents<br />
in 2012).<br />
Overall, the frequency rate of accidents decreased by<br />
22% in 2012 (from 13.7 to 10.7 accidents per million<br />
hours worked).<br />
A total of 454 working days were lost dueto occupational<br />
accidents in 2012. On a comparable basis, the figure<br />
amounted to 440 in 2012 against 605 in 2011, a 27%<br />
decrease. As the total number of hours increased from<br />
2,4 million to 3,3 million, the severity rate was further<br />
reduced from 0,25 days lost / thousand hours to 0,14<br />
days lost / thousand hours (down by 44%). The vast<br />
majority of days (399) were lost in Europe, mainly in<br />
the Belgian subsidiary ACS. Asia has clearly improved<br />
compared to last year (33 days lost, against 246 in 2011).<br />
Occupational disease rate by region (number of<br />
days lost / thousands working hours )<br />
In 2012, 1179 working days were lost due to occupational<br />
diseases, the majority (892 days) of them in Europe.<br />
On a comparable basis, the total figure amounted to<br />
939 days in 2012 against 1086 days in 2011, a 14%<br />
decrease. In contrast the figure amounted to 240 days<br />
for the two Asian companies which were added to the<br />
scope in 2012 (one in India and one in Saudi Arabia),<br />
which explains the growth in Asia and Africa / Middle<br />
East in 2012.