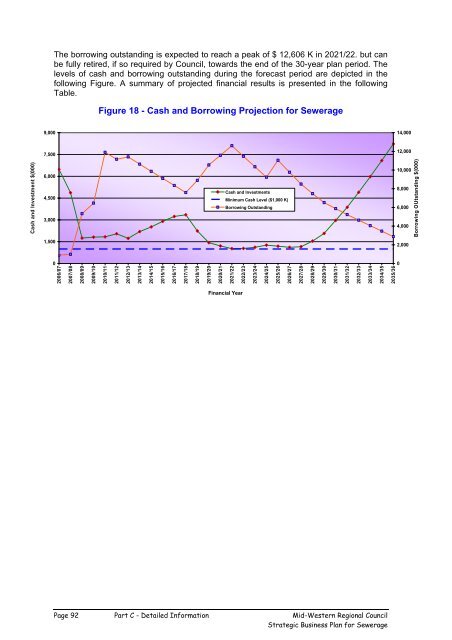
The borrowing outstanding is expected to reach a peak of $ 12,606 K in 2021/22. but can be fully retired, if so required by <strong>Council</strong>, towards the end of the 30-year plan period. The levels of cash and borrowing outstanding during the forecast period are depicted in the following Figure. A summary of projected financial results is presented in the following Table. Figure 18 - Cash and Borrowing Projection for Sewerage 9,000 14,000 7,500 12,000 Cash and Investment $(000) 6,000 4,500 3,000 Cash and Investments Minimum Cash Level ($1,000 K) Borrowing Outstanding 10,000 8,000 6,000 4,000 Borrowing OUtstanding $(000) 1,500 2,000 0 2006/07 2007/08 2008/09 2009/10 2010/11 2011/12 2012/13 2013/14 2014/15 2015/16 2016/17 2017/18 2018/19 2019/20 2020/21 2021/22 2022/23 2023/24 2024/25 2025/26 2026/27 2027/28 2028/29 2029/30 2030/31 2031/32 2032/33 2033/34 2034/35 2035/36 0 Financial Year Page 92 Part C - Detailed Information <strong>Mid</strong>-<strong>Western</strong> <strong>Regional</strong> <strong>Council</strong> Strategic Business Plan for Sewerage
Figure 19 - Projected Financial Results for Sewerage 2006/07 ($000) Revenue and Expenses Capital Transactions Financial Position System Assets Financial Year Total Revenue Total Expenses Operating Result (Before Grants) Acquisition of Assets Principal Loan Payments Cash and Investments Borrowings Total Assets Total Liabilities Net Assets Committed Current Replacement Cost Less: Accumulated Depreciation Written Down Current Cost Typical Residential Bills 2006/07 3,482 2,829 653 814 53 6,483 909 25,537 1,033 24,504 41,775 22,826 18,949 460 2007/08 4,150 3,069 1,082 3,388 53 4,873 979 26,528 1,105 25,423 44,841 23,292 21,549 460 2008/09 6,463 3,445 3,018 11,330 170 1,747 5,330 33,787 5,459 28,328 55,847 23,915 31,932 490 2009/10 3,712 3,524 188 2,332 215 1,814 6,460 35,213 6,592 28,621 57,853 24,564 33,288 490 2010/11 3,929 4,060 (131) 6,484 376 1,836 11,896 40,663 12,037 28,626 64,009 25,300 38,710 490 2011/12 4,006 4,084 (78) 335 388 2,045 11,161 40,147 11,305 28,842 64,009 26,028 37,981 490 2012/13 4,077 4,148 (71) 1,845 428 1,729 11,408 40,592 11,556 29,036 65,519 26,779 38,740 490 2013/14 4,161 4,142 20 145 442 2,195 10,634 40,123 10,784 29,339 65,329 27,526 37,803 490 2014/15 4,250 4,143 107 345 459 2,517 9,865 39,710 10,018 29,692 65,339 28,273 37,065 490 2015/16 4,335 4,142 193 345 474 2,902 9,104 39,361 9,261 30,100 65,349 29,020 36,328 490 2016/17 4,392 4,170 222 395 490 3,239 8,349 39,012 8,508 30,504 65,409 29,768 35,641 490 2017/18 4,462 4,143 319 695 509 3,349 7,597 38,731 7,759 30,972 65,769 30,521 35,248 490 2018/19 4,505 4,330 175 3,845 581 2,240 8,895 40,332 9,060 31,272 69,278 31,323 37,955 490 2019/20 4,534 4,534 0 3,845 587 1,433 10,549 42,184 10,717 31,467 72,788 32,176 40,612 490 2020/21 4,580 4,681 (100) 2,645 662 1,206 11,580 43,383 11,750 31,633 75,098 33,063 42,035 490 2021/22 4,634 4,856 (223) 2,546 737 1,021 12,606 44,492 12,779 31,713 77,309 33,981 43,328 490 2022/23 4,696 4,797 (102) 345 763 1,036 11,476 43,601 11,651 31,950 77,319 34,900 42,419 490 2023/24 4,761 4,768 (7) 345 790 1,119 10,352 42,778 10,530 32,248 77,329 35,819 41,510 490 2024/25 4,823 4,738 85 345 818 1,263 9,233 42,015 9,413 32,602 77,339 36,738 40,601 490 2025/26 4,881 4,944 (63) 3,345 923 1,193 11,042 43,996 11,224 32,772 80,349 37,700 42,649 490 2026/27 4,942 4,936 6 395 954 1,115 9,766 43,017 9,951 33,066 80,409 38,663 41,747 490 2027/28 5,007 4,863 144 395 979 1,153 8,502 42,153 8,690 33,463 80,470 39,627 40,843 490 2028/29 5,077 4,824 253 345 782 1,544 7,472 41,593 7,662 33,931 80,479 40,590 39,889 490 2029/30 5,152 4,800 352 345 735 2,071 6,520 41,169 6,713 34,456 80,490 41,554 38,936 490 2030/31 5,238 4,782 456 345 457 2,966 5,874 41,112 6,069 35,043 80,500 42,517 37,982 490 2031/32 5,322 4,815 507 345 472 3,869 5,230 41,063 5,428 35,635 80,509 43,481 37,028 490 2032/33 5,409 4,780 629 345 439 4,902 4,639 41,144 4,840 36,304 80,520 44,445 36,075 490 2033/34 5,492 4,781 712 345 454 5,973 4,050 41,262 4,253 37,009 80,529 45,409 35,120 490 2034/35 5,579 4,781 798 345 469 7,082 3,463 41,420 3,668 37,752 80,539 46,373 34,166 490 2035/36 5,666 4,784 883 345 486 8,228 2,876 41,614 3,084 38,530 80,549 47,337 33,213 490 Sensitivity Analysis In accordance with the DWE Financial Guidelines, the following sensitivities have been modelled to determine the impact of various scenarios on typical residential bill for sewerage. Criteria Preferred Case Sensitivity Growth Rate 1.7% p.a. 0.9% p.a. Interest Rates Borrow @ 6.5% and invest @ 5.5% Borrow @ 9% and invest @ 8% Subsidy As expected by <strong>Council</strong> No Subsidy The results of modelling are presented in both graphic and tabular form. Note that the cash and borrowings are similar in most years to facilitate comparability between cases. <strong>Mid</strong>-<strong>Western</strong> <strong>Regional</strong> <strong>Council</strong> Part C - Detailed Information Page 93 Strategic Business Plan for Sewerage