

Editorial & Advisory Board - Acta Technica Corviniensis
Editorial & Advisory Board - Acta Technica Corviniensis
Editorial & Advisory Board - Acta Technica Corviniensis

You also want an ePaper? Increase the reach of your titles
YUMPU automatically turns print PDFs into web optimized ePapers that Google loves.
We can now read the ABAP instructions runtime time<br />
in microseconds, as well as the time to work with the<br />
database and runtime time operating system.<br />
CODE TESTING TOOL: MEMORY ANALYSIS<br />
An analysis of the software memory can be used by<br />
the Debugging process. We should use the Replace<br />
Tool from the Toolbar and choose to receive the<br />
Special Tool ‐ Figure 4, and then we choose Memory<br />
Analysis option to analyze it in terms of memory used<br />
in the software code.<br />
ACTA TECHNICA CORVINIENSIS – Bulletin of Engineering<br />
Figure 4. Memory analysis by debbuger<br />
Figure 5 describes the memory test results of codes in<br />
YALLS_ARRAY_FETCH_DATA_REF software.<br />
Figure 5. Memory analysis results<br />
In Figure 5, memory size is specified in bytes. Special<br />
areas of memory are: Heap Memory ‐private memory<br />
reserved for runtime processes of the Application<br />
Server; Roll Memory is reserved for copying data<br />
sources such as roll file, if the runtime processes of<br />
application server change; Short memory ‐ memory<br />
for storing intermediate results resulting from the use<br />
of such a screen is automatically cleaned after each<br />
dialog step.<br />
STAD TRANSACTION (BUSINESS TRANSACTION ANALYSIS)<br />
Business Transactions Analysis calculates the system<br />
resource usage of individual transactions for ABAP<br />
systems and provides a detailed analysis of a<br />
transaction and the dialog steps. The selection criteria<br />
include user, transaction, program, task type, start<br />
date, and start time. [1]<br />
108<br />
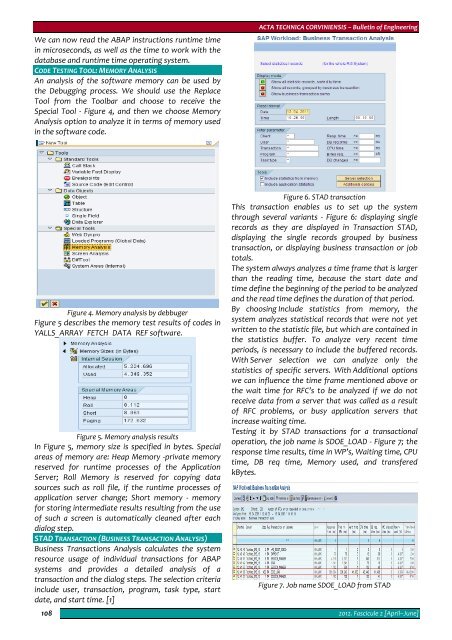
Figure 6. STAD transaction<br />
This transaction enables us to set up the system<br />
through several variants ‐ Figure 6: displaying single<br />
records as they are displayed in Transaction STAD,<br />
displaying the single records grouped by business<br />
transaction, or displaying business transaction or job<br />
totals.<br />
The system always analyzes a time frame that is larger<br />
than the reading time, because the start date and<br />
time define the beginning of the period to be analyzed<br />
and the read time defines the duration of that period.<br />
By choosing Include statistics from memory, the<br />
system analyzes statistical records that were not yet<br />
written to the statistic file, but which are contained in<br />
the statistics buffer. To analyze very recent time<br />
periods, is necessary to include the buffered records.<br />
With Server selection we can analyze only the<br />
statistics of specific servers. With Additional options<br />
we can influence the time frame mentioned above or<br />
the wait time for RFC’s to be analyzed if we do not<br />
receive data from a server that was called as a result<br />
of RFC problems, or busy application servers that<br />
increase waiting time.<br />
Testing it by STAD transactions for a transactional<br />
operation, the job name is SDOE_LOAD ‐ Figure 7; the<br />
response time results, time in WP’s, Waiting time, CPU<br />
time, DB req time, Memory used, and transfered<br />
kBytes.<br />
Figure 7. Job name SDOE_LOAD from STAD<br />
2012. Fascicule 2 [April–June]


