

Editorial & Advisory Board - Acta Technica Corviniensis
Editorial & Advisory Board - Acta Technica Corviniensis
Editorial & Advisory Board - Acta Technica Corviniensis

You also want an ePaper? Increase the reach of your titles
YUMPU automatically turns print PDFs into web optimized ePapers that Google loves.
ACTA TECHNICA CORVINIENSIS – Bulletin of Engineering<br />
Instead of the absorption band at 1241 cm ‐1 ,<br />
corresponding to vibration frequency of C‐O bond<br />
appear two absorption bands at 1234 cm ‐1 and 1266 cm ‐<br />
1 . They correspond to C‐O bonds in the acetate group<br />
linked to the macromolecular chain or partially<br />
released. Also, there is a decrease in the intensity of<br />
the absorption band at 1124 cm ‐1 corresponding to the<br />
vibrations of C‐C‐O bonds [3].<br />
The spectra obtained can be processed to obtain the<br />
optical constants n (refractive index) and k<br />
(absorption index). We used 1381 points and 55<br />
parameters in the fitting process.<br />
To improve the accuracy of the dielectric function we<br />
used simultaneously the fitting process of reflectionabsorption<br />
spectra recorded at a 20 degrees incidence<br />
angle and the refractive index of PVAc value n f =<br />
1.4665 [1].<br />
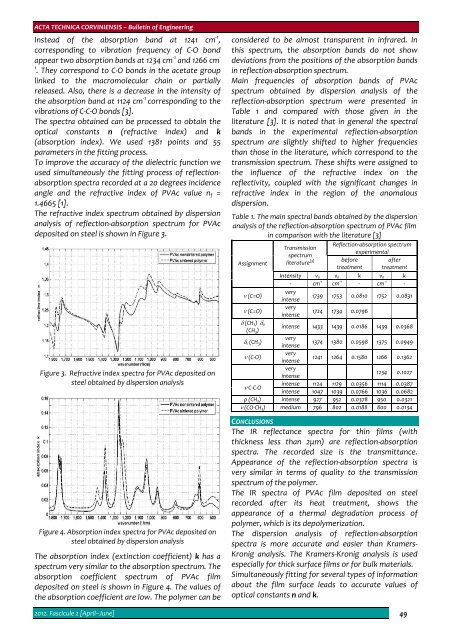
The refractive index spectrum obtained by dispersion<br />
analysis of reflection‐absorption spectrum for PVAc<br />
deposited on steel is shown in Figure 3.<br />
Figure 3. Refractive index spectra for PVAc deposited on<br />
steel obtained by dispersion analysis<br />
Figure 4. Absorption index spectra for PVAc deposited on<br />
steel obtained by dispersion analysis<br />
The absorption index (extinction coefficient) k has a<br />
spectrum very similar to the absorption spectrum. The<br />
absorption coefficient spectrum of PVAc film<br />
deposited on steel is shown in Figure 4. The values of<br />
the absorption coefficient are low. The polymer can be<br />
considered to be almost transparent in infrared. In<br />
this spectrum, the absorption bands do not show<br />
deviations from the positions of the absorption bands<br />
in reflection‐absorption spectrum.<br />
Main frequencies of absorption bands of PVAc<br />
spectrum obtained by dispersion analysis of the<br />
reflection‐absorption spectrum were presented in<br />
Table 1 and compared with those given in the<br />
literature [3]. It is noted that in general the spectral<br />
bands in the experimental reflection‐absorption<br />
spectrum are slightly shifted to higher frequencies<br />
than those in the literature, which correspond to the<br />
transmission spectrum. These shifts were assigned to<br />
the influence of the refractive index on the<br />
reflectivity, coupled with the significant changes in<br />
refractive index in the region of the anomalous<br />
dispersion.<br />
Table 1. The main spectral bands obtained by the dispersion<br />
analysis of the reflection‐absorption spectrum of PVAc film<br />
in comparison with the literature [3]<br />
Assignment<br />
ν (C=O)<br />
ν (C=O)<br />
Transmission<br />
spectrum<br />
literature [3]<br />
Reflection‐absorption spectrum<br />
experimental<br />
before<br />
after<br />
treatment treatment<br />
Intensity ν 0 ν 0 k ν 0 k<br />
‐ cm ‐1 cm ‐1 ‐ cm ‐1 ‐<br />
very<br />
intense<br />
1739 1753 0.0810 1752 0.0831<br />
very<br />
intense<br />
1724 1734 0.0796<br />
δ (CH 2 ) δ a<br />
(CH 3 )<br />
intense 1433 1439 0.0186 1439 0.0368<br />
δ s (CH 3 )<br />
very<br />
intense<br />
1374 1380 0.0598 1375 0.0949<br />
ν (C‐O)<br />
very<br />
intense<br />
1241 1264 0.1580 1266 0.1362<br />
very<br />
intense<br />
1234 0.1027<br />
ν C‐C‐O<br />
intense 1124 1129 0.0356 1114 0.0387<br />
intense 1047 1039 0.0766 1036 0.0682<br />
ρ (CH 3 ) intense 927 952 0.0378 950 0.0321<br />
ν (CO‐CH 3 ) medium 796 802 0.0188 800 0.0134<br />
CONCLUSIONS<br />
The IR reflectance spectra for thin films (with<br />
thickness less than 2μm) are reflection‐absorption<br />
spectra. The recorded size is the transmittance.<br />
Appearance of the reflection‐absorption spectra is<br />
very similar in terms of quality to the transmission<br />
spectrum of the polymer.<br />
The IR spectra of PVAc film deposited on steel<br />
recorded after its heat treatment, shows the<br />
appearance of a thermal degradation process of<br />
polymer, which is its depolymerization.<br />
The dispersion analysis of reflection‐absorption<br />
spectra is more accurate and easier than Kramers‐<br />
Kronig analysis. The Kramers‐Kronig analysis is used<br />
especially for thick surface films or for bulk materials.<br />
Simultaneously fitting for several types of information<br />
about the film surface leads to accurate values of<br />
optical constants n and k.<br />
2012. Fascicule 2 [April–June] 49


