

Editorial & Advisory Board - Acta Technica Corviniensis
Editorial & Advisory Board - Acta Technica Corviniensis
Editorial & Advisory Board - Acta Technica Corviniensis

Create successful ePaper yourself
Turn your PDF publications into a flip-book with our unique Google optimized e-Paper software.
three types of basic controllers to select from. The<br />
three types of controllers are: (1) PI (Proportional and<br />
Integral), (2) PD (Proportional and Derivative), and (3)<br />
PID (Proportional, Integral, and Derivative). These<br />
three types of controllers are routinely used in<br />
automated control systems and the software provides<br />
the flexibility of choosing any one of them. Any<br />
controller, chosen, has already been adjusted by the<br />
software to meet the optimum output criteria of the<br />
particular process under consideration.<br />
The predictions of the software were validated in the<br />
case of a PID controller against experimental data and<br />
analysis. The PID controller was selected as it is the<br />
most common feedback controller used in dynamic<br />
closed loop control systems in automated industrial<br />
processes. The results of the validation along with the<br />
discrepancies observed are discussed in this paper<br />
along with suggestion to improve the prediction<br />
process.<br />
CONTROLLER ARCHITECTURES<br />
A. PID CONTROLLERS<br />
PID controllers calculate an error ‘e’ value, for the<br />
process, as the difference between a measured<br />
process variable ‘Y’ and a desired setpoint ‘R’. The<br />
controller attempts to minimize the error by adjusting<br />
the process control inputs ‘u’. the PID controller<br />
algorithm involves three separate parameters: (1) The<br />
Proportional ‘P,’ denoted by the proportional gain<br />
‘K p ’, (2) The Integral ‘I,’ represented by the Integral<br />
gain ‘K I ,’ and (3) The Derivative ‘D,’ usually<br />
represented by the derivative gain ‘K D .’ The P depends<br />
on the present error, the I on the past error, and the D<br />
on the future error. The weighted sum of these three<br />
actions is utilized by the PID controller in order to<br />
generate the necessary process control signal u for the<br />
control of such parameters as the position of a control<br />
valve or in the case of the present research the power<br />
supply of a heating element. Due to its inherent<br />
flexibility, the PID controller is usually used, especially,<br />
where the underlying process in too complicated.<br />
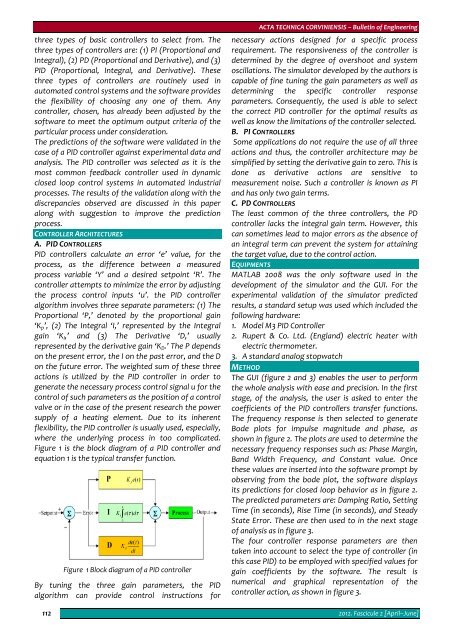
Figure 1 is the block diagram of a PID controller and<br />
equation 1 is the typical transfer function.<br />
112<br />
Figure 1 Block diagram of a PID controller<br />
By tuning the three gain parameters, the PID<br />
algorithm can provide control instructions for<br />
ACTA TECHNICA CORVINIENSIS – Bulletin of Engineering<br />
necessary actions designed for a specific process<br />
requirement. The responsiveness of the controller is<br />
determined by the degree of overshoot and system<br />
oscillations. The simulator developed by the authors is<br />
capable of fine tuning the gain parameters as well as<br />
determining the specific controller response<br />
parameters. Consequently, the used is able to select<br />
the correct PID controller for the optimal results as<br />
well as know the limitations of the controller selected.<br />
B. PI CONTROLLERS<br />
Some applications do not require the use of all three<br />
actions and thus, the controller architecture may be<br />
simplified by setting the derivative gain to zero. This is<br />
done as derivative actions are sensitive to<br />
measurement noise. Such a controller is known as PI<br />
and has only two gain terms.<br />
C. PD CONTROLLERS<br />
The least common of the three controllers, the PD<br />
controller lacks the integral gain term. However, this<br />
can sometimes lead to major errors as the absence of<br />
an integral term can prevent the system for attaining<br />
the target value, due to the control action.<br />
EQUIPMENTS<br />
MATLAB 2008 was the only software used in the<br />
development of the simulator and the GUI. For the<br />
experimental validation of the simulator predicted<br />
results, a standard setup was used which included the<br />
following hardware:<br />
1. Model M3 PID Controller<br />
2. Rupert & Co. Ltd. (England) electric heater with<br />
electric thermometer.<br />
3. A standard analog stopwatch<br />
METHOD<br />
The GUI (figure 2 and 3) enables the user to perform<br />
the whole analysis with ease and precision. In the first<br />
stage, of the analysis, the user is asked to enter the<br />
coefficients of the PID controllers transfer functions.<br />
The frequency response is then selected to generate<br />
Bode plots for impulse magnitude and phase, as<br />
shown in figure 2. The plots are used to determine the<br />
necessary frequency responses such as: Phase Margin,<br />
Band Width Frequency, and Constant value. Once<br />
these values are inserted into the software prompt by<br />
observing from the bode plot, the software displays<br />
its predictions for closed loop behavior as in figure 2.<br />
The predicted parameters are: Damping Ratio, Setting<br />
Time (in seconds), Rise Time (in seconds), and Steady<br />
State Error. These are then used to in the next stage<br />
of analysis as in figure 3.<br />
The four controller response parameters are then<br />
taken into account to select the type of controller (in<br />
this case PID) to be employed with specified values for<br />
gain coefficients by the software. The result is<br />
numerical and graphical representation of the<br />
controller action, as shown in figure 3.<br />
2012. Fascicule 2 [April–June]


