

Editorial & Advisory Board - Acta Technica Corviniensis
Editorial & Advisory Board - Acta Technica Corviniensis
Editorial & Advisory Board - Acta Technica Corviniensis

You also want an ePaper? Increase the reach of your titles
YUMPU automatically turns print PDFs into web optimized ePapers that Google loves.
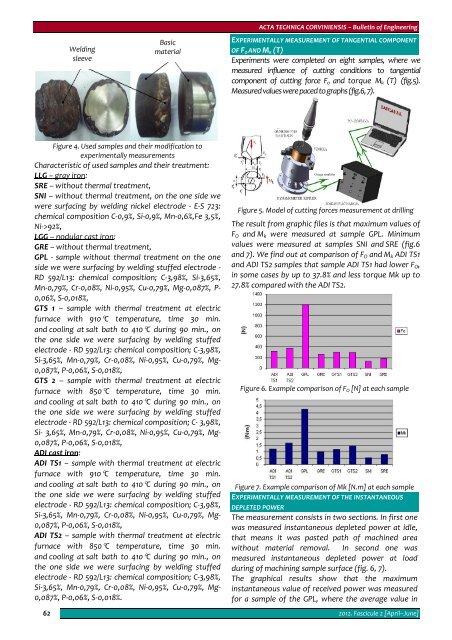
Welding<br />
sleeve<br />
Basic<br />
material<br />
ACTA TECHNICA CORVINIENSIS – Bulletin of Engineering<br />
EXPERIMENTALLY MEASUREMENT OF TANGENTIAL COMPONENT<br />
OF F O AND M K (T)<br />
Experiments were completed on eight samples, where we<br />
measured influence of cutting conditions to tangential<br />
component of cutting force F o and torque M k (T) (fig.5).<br />
Measured values were paced to graphs (fig.6, 7).<br />
Figure 4. Used samples and their modification to<br />
experimentally measurements<br />
Characteristic of used samples and their treatment:<br />
LLG – gray iron:<br />
SRE – without thermal treatment,<br />
SNI – without thermal treatment, on the one side we<br />
were surfacing by welding nickel electrode ‐ E‐S 723:<br />
chemical composition C‐0,9%, Si‐0,9%, Mn‐0,6%,Fe 3,5%,<br />
Ni‐>92%,<br />
LGG – nodular cast iron:<br />
GRE – without thermal treatment,<br />
GPL ‐ sample without thermal treatment on the one<br />
side we were surfacing by welding stuffed electrode ‐<br />
RD 592/L13: chemical composition; C‐3,98%, Si‐3,65%,<br />
Mn‐0,79%, Cr‐0,08%, Ni‐0,95%, Cu‐0,79%, Mg‐0,087%, P‐<br />
0,06%, S‐0,018%,<br />
GTS 1 – sample with thermal treatment at electric<br />
furnace with 910°C temperature, time 30 min.<br />
and cooling at salt bath to 410°C during 90 min., on<br />
the one side we were surfacing by welding stuffed<br />
electrode ‐ RD 592/L13: chemical composition; C‐3,98%,<br />
Si‐3,65%, Mn‐0,79%, Cr‐0,08%, Ni‐0,95%, Cu‐0,79%, Mg‐<br />
0,087%, P‐0,06%, S‐0,018%,<br />
GTS 2 – sample with thermal treatment at electric<br />
furnace with 850°C temperature, time 30 min.<br />
and cooling at salt bath to 410°C during 90 min., on<br />
the one side we were surfacing by welding stuffed<br />
electrode ‐ RD 592/L13: chemical composition; C‐ 3,98%,<br />
Si‐ 3,65%, Mn‐0,79%, Cr‐0,08%, Ni‐0,95%, Cu‐0,79%, Mg‐<br />
0,087%, P‐0,06%, S‐0,018%,<br />
ADI cast iron:<br />
ADI TS1 – sample with thermal treatment at electric<br />
furnace with 910°C temperature, time 30 min.<br />
and cooling at salt bath to 410°C during 90 min., on<br />
the one side we were surfacing by welding stuffed<br />
electrode ‐ RD 592/L13: chemical composition; C‐3,98%,<br />
Si‐3,65%, Mn‐0,79%, Cr‐0,08%, Ni‐0,95%, Cu‐0,79%, Mg‐<br />
0,087%, P‐0,06%, S‐0,018%,<br />
ADI TS2 – sample with thermal treatment at electric<br />
furnace with 850°C temperature, time 30 min.<br />
and cooling at salt bath to 410°C during 90 min., on<br />
the one side we were surfacing by welding stuffed<br />
electrode ‐ RD 592/L13: chemical composition; C‐3,98%,<br />
Si‐3,65%, Mn‐0,79%, Cr‐0,08%, Ni‐0,95%, Cu‐0,79%, Mg‐<br />
0,087%, P‐0,06%, S‐0,018%.<br />
62<br />
Charge amplifier<br />
Figure 5. Model of cutting forces measurement at drilling<br />
The result from graphic files is that maximum values of<br />
F O and M k were measured at sample GPL. Minimum<br />
values were measured at samples SNI and SRE (fig.6<br />
and 7). We find out at comparison of F O and M k ADI TS1<br />
and ADI TS2 samples that sample ADI TS1 had lower F O ,<br />
in some cases by up to 37.8% and less torque Mk up to<br />
27.8% compared with the ADI TS2.<br />
Figure 6. Example comparison of F O [N] at each sample<br />
Figure 7. Example comparison of Mk [N.m] at each sample<br />
EXPERIMENTALLY MEASUREMENT OF THE INSTANTANEOUS<br />
DEPLETED POWER<br />
The measurement consists in two sections. In first one<br />
was measured instantaneous depleted power at idle,<br />
that means it was pasted path of machined area<br />
without material removal. In second one was<br />
measured instantaneous depleted power at load<br />
during of machining sample surface (fig. 6, 7).<br />
The graphical results show that the maximum<br />
instantaneous value of received power was measured<br />
for a sample of the GPL, where the average value in<br />
2012. Fascicule 2 [April–June]


