

Editorial & Advisory Board - Acta Technica Corviniensis
Editorial & Advisory Board - Acta Technica Corviniensis
Editorial & Advisory Board - Acta Technica Corviniensis

Create successful ePaper yourself
Turn your PDF publications into a flip-book with our unique Google optimized e-Paper software.
ACTA TECHNICA CORVINIENSIS – Bulletin of Engineering<br />
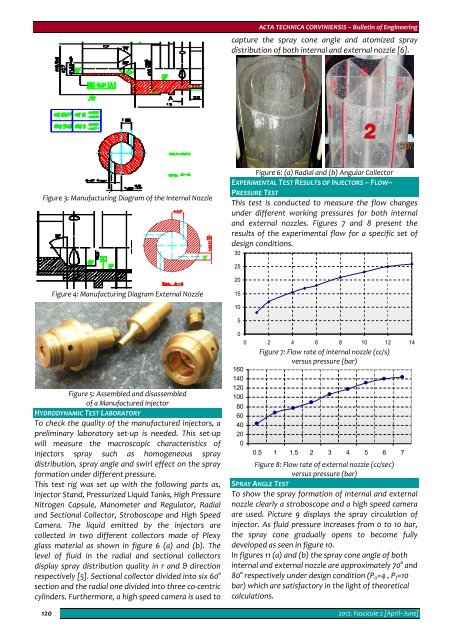
capture the spray cone angle and atomized spray<br />
distribution of both internal and external nozzle [6].<br />
Figure 3: Manufacturing Diagram of the Internal Nozzle<br />
Figure 6: (a) Radial and (b) Angular Collector<br />
EXPERIMENTAL TEST RESULTS OF INJECTORS – FLOW–<br />
PRESSURE TEST<br />
This test is conducted to measure the flow changes<br />
under different working pressures for both internal<br />
and external nozzles. Figures 7 and 8 present the<br />
results of the experimental flow for a specific set of<br />
design conditions.<br />
30<br />
25<br />
20<br />
Figure 4: Manufacturing Diagram External Nozzle<br />
15<br />
10<br />
5<br />
Figure 5: Assembled and disassembled<br />
of a Manufactured Injector<br />
HYDRODYNAMIC TEST LABORATORY<br />
To check the quality of the manufactured injectors, a<br />
preliminary laboratory set‐up is needed. This set‐up<br />
will measure the macroscopic characteristics of<br />
injectors spray such as homogeneous spray<br />
distribution, spray angle and swirl effect on the spray<br />
formation under different pressure.<br />
This test rig was set up with the following parts as,<br />
Injector Stand, Pressurized Liquid Tanks, High Pressure<br />
Nitrogen Capsule, Manometer and Regulator, Radial<br />
and Sectional Collector, Stroboscope and High Speed<br />
Camera. The liquid emitted by the injectors are<br />
collected in two different collectors made of Plexy<br />
glass material as shown in figure 6 (a) and (b). The<br />
level of fluid in the radial and sectional collectors<br />
display spray distribution quality in r and θ direction<br />
respectively [5]. Sectional collector divided into six 60°<br />
section and the radial one divided into three co‐centric<br />
cylinders. Furthermore, a high speed camera is used to<br />
120<br />
0<br />
0 2 4 6 8 10 12 14<br />
Figure 7: Flow rate of internal nozzle (cc/s)<br />
versus pressure (bar)<br />
160<br />
140<br />
120<br />
100<br />
80<br />
60<br />
40<br />
20<br />
0<br />
0.5 1 1.5 2 3 4 5 6 7<br />
Figure 8: Flow rate of external nozzle (cc/sec)<br />
versus pressure (bar)<br />
SPRAY ANGLE TEST<br />
To show the spray formation of internal and external<br />
nozzle clearly a stroboscope and a high speed camera<br />
are used. Picture 9 displays the spray circulation of<br />
injector. As fluid pressure increases from 0 to 10 bar,<br />
the spray cone gradually opens to become fully<br />
developed as seen in figure 10.<br />
In figures 11 (a) and (b) the spray cone angle of both<br />
internal and external nozzle are approximately 70° and<br />
80° respectively under design condition (P o =4 , P f =10<br />
bar) which are satisfactory in the light of theoretical<br />
calculations.<br />
2012. Fascicule 2 [April–June]


