

Editorial & Advisory Board - Acta Technica Corviniensis
Editorial & Advisory Board - Acta Technica Corviniensis
Editorial & Advisory Board - Acta Technica Corviniensis

You also want an ePaper? Increase the reach of your titles
YUMPU automatically turns print PDFs into web optimized ePapers that Google loves.
est known is Drude‐Lorentz model [6, 9, 12] which<br />
defines the electric permittivity:<br />
2<br />
ν pj<br />
ε ( ν ) = ε ∞ + ∑<br />
2 2<br />
(1)<br />
j ν 0 j −ν<br />
− iγ<br />
jν<br />
It describes the optical response of a set of harmonic<br />
(damped) oscillators. In this relation, ε ∞ is so‐called<br />
"high‐frequency dielectric constant”, which<br />
represents the contribution of all oscillators at very<br />
high frequencies (compared to frequency range under<br />
consideration). The parameters ν pj , ν 0j and γ j are the<br />
“plasma” frequency, the transverse frequency (eigenfrequency),<br />
and the line‐width (scattering rate),<br />
respectively of the j‐th Lorentz oscillator. For the<br />
proposed model, from permittivity, we can calculate<br />
all optical quantities such as reflectance R and<br />
transmittance T. The spectrum of these theoretically<br />
calculated quantities is compared with those<br />
experimentally determined. The model parameters<br />
are continuously adjusted to fit the theoretical values<br />
with experimentally measured data. In case of<br />
reflection‐absorption spectra the theoretical<br />
transmittance and experimental transmittance<br />
spectra are compared. The fitting parameters process<br />
stops when the differences between theoretical and<br />
experimental spectra are minimal.<br />
Suppose, we have a set of N experimental data points<br />
{ν j , T j , σ j } (j = 1, .... N) that we want to fit. Here, ν j is the<br />
light frequency, T j is the transmittance, and σ j is the<br />
data error bar. For a set of M internal parameters, the<br />
values T = T model (ν, p 1 , .... P M ) are calculated based on<br />
the model.<br />
The so‐called Levenberg‐Marquardt algorithm is used<br />
to minimize the value:<br />
( ν , p ....p )<br />
exp model<br />
N ⎛<br />
2<br />
Tj<br />
−T<br />
⎞<br />
j j j M 2<br />
χ = ∑⎜<br />
⎟ = χ ( p1<br />
,....pM<br />
) (2)<br />
j<br />
σ<br />
⎝<br />
j ⎠<br />
Fitting process stops when the stopping criterion is<br />
met [8].<br />
EXPERIMENTAL<br />
Thin films of polyvinyl acetate (PVAc) were obtained<br />
by spraying a polymer solution on the surface of a<br />
steel metal sample. Low concentration of polymer in<br />
the solvent allowed us to obtain thin films with<br />
thickness less than 2μm. After evaporation of the<br />
solvent the IR reflection‐absorption spectra at 20 0<br />
incidence angle was recorded.<br />
The metal sample coated with polymer film was then<br />
heated to a temperature of 80 0 C for 30 minutes to<br />
complete removal of the solvent. After the sample<br />
heat treatment we recorded IR reflection‐absorption<br />
spectrum again. The metal surface used as substrate<br />
for the polymer film was obtained by grinding and<br />
polishing.<br />
2<br />
ACTA TECHNICA CORVINIENSIS – Bulletin of Engineering<br />
The IR reflection‐absorption spectra were recorded<br />
using a specular reflectance device for UR‐20<br />
spectrograph.<br />
The reflection‐absorption spectra were processed<br />
using the program RefFIT [8] to obtain the optical<br />
constants of polymer film.<br />
RESULTS AND DISCUSSION<br />
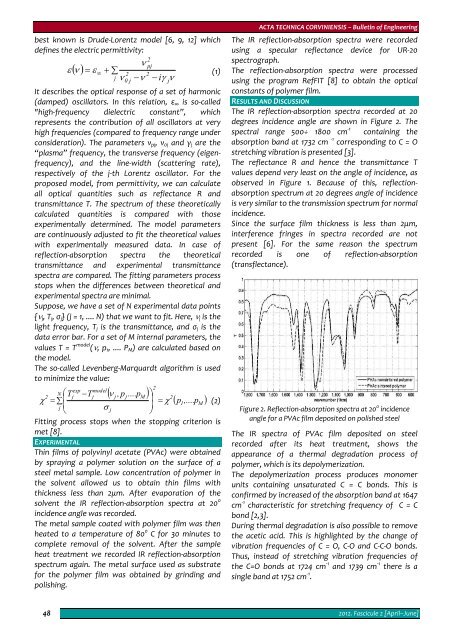
The IR reflection‐absorption spectra recorded at 20<br />
degrees incidence angle are shown in Figure 2. The<br />
spectral range 500÷ 1800 cm ‐1 containing the<br />
absorption band at 1732 cm ‐1 corresponding to C = O<br />
stretching vibration is presented [3].<br />
The reflectance R and hence the transmittance T<br />
values depend very least on the angle of incidence, as<br />
observed in Figure 1. Because of this, reflectionabsorption<br />
spectrum at 20 degrees angle of incidence<br />
is very similar to the transmission spectrum for normal<br />
incidence.<br />
Since the surface film thickness is less than 2μm,<br />
interference fringes in spectra recorded are not<br />
present [6]. For the same reason the spectrum<br />
recorded is one of reflection‐absorption<br />
(transflectance).<br />
Figure 2. Reflection‐absorption spectra at 20 0 incidence<br />
angle for a PVAc film deposited on polished steel<br />
The IR spectra of PVAc film deposited on steel<br />
recorded after its heat treatment, shows the<br />
appearance of a thermal degradation process of<br />
polymer, which is its depolymerization.<br />
The depolymerization process produces monomer<br />
units containing unsaturated C = C bonds. This is<br />
confirmed by increased of the absorption band at 1647<br />
cm ‐1 characteristic for stretching frequency of C = C<br />
bond [2,3].<br />
During thermal degradation is also possible to remove<br />
the acetic acid. This is highlighted by the change of<br />
vibration frequencies of C = O, C‐O and C‐C‐O bonds.<br />
Thus, instead of stretching vibration frequencies of<br />
the C=O bonds at 1724 cm ‐1 and 1739 cm ‐1 there is a<br />
single band at 1752 cm ‐1 .<br />
48<br />
2012. Fascicule 2 [April–June]


