

Editorial & Advisory Board - Acta Technica Corviniensis
Editorial & Advisory Board - Acta Technica Corviniensis
Editorial & Advisory Board - Acta Technica Corviniensis

Create successful ePaper yourself
Turn your PDF publications into a flip-book with our unique Google optimized e-Paper software.
e attaching on the discharge wires. A voltage drop<br />
will be on the dust layer. Electrically, a high current<br />
occurs on the low voltage operation, and specify to<br />
back Corona, the rise current‐voltage characteristic is<br />
different then fall current‐voltage characteristic<br />
(Figure 3) [5,6].<br />
Figure 2. The back Corona between the electrodes<br />
A positive back‐Corona discharge occurs when the<br />
Corona discharge and layer resistivity are high (10 10 ‐10 11<br />
Ω⋅cm). The positive ions from the dust layer drift<br />
towards the discharge wires and charged the dust<br />
particles with positive charges. The discharge wires<br />
become the collecting wires, but the total surface it is<br />
not large enough and the particles remain uncollected.<br />
The collecting efficiency of ESP drastically<br />
decreases.<br />
Usually, the value of electric field in a dust layer is 10‐<br />
20 kV/cm, and the value of electric field of air is 26<br />
kV/cm.<br />
ACTA TECHNICA CORVINIENSIS – Bulletin of Engineering<br />
E l = ρ ⋅ J<br />
(2)<br />
In time, various methods have been proposed to<br />
detect the back Corona. The ratio between the peak<br />
and the mean value of the secondary voltage depends<br />
on the back Corona. Other electrical parameters that<br />
depend on back Corona are: power supply impedance,<br />
supply frequency, precipitator load characteristics.<br />
A method is to inhibit the thyristors pulses for a<br />
period of time, and than applied pulses for a period of<br />
time t 1 . The controller monitors the effect of the decay<br />
voltage. In this period of time is analyzing the decay<br />
characteristics of the voltage. Back Corona is detected<br />
when is available the equation:<br />
U ref − Uoffset<br />
> Udecay<br />
(3)<br />
where U ref is a reference voltage in the non back<br />
Corona condition, U offset is the offset voltage to<br />
determine the sensitivity of the detection and it is a<br />
controller parameter, and U decay is a decay voltage that<br />
is measure Corona onset voltage. The secondary<br />
voltage is recorded after the time t 1 .<br />
DISCUSSION<br />
At operation of the ESP it is necessary to avoid the<br />
negative effects of the back Corona discharges.<br />
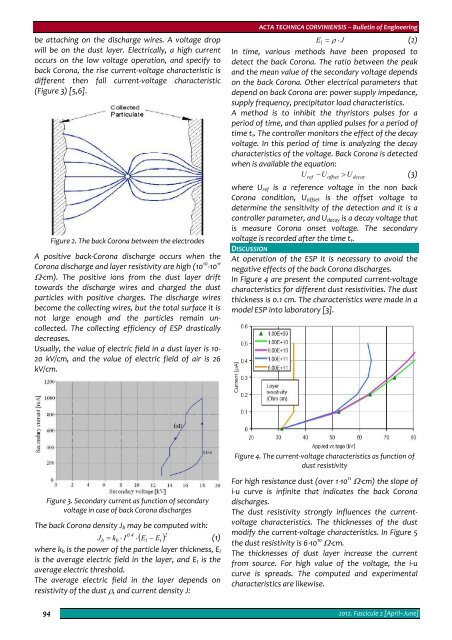
In Figure 4 are present the computed current‐voltage<br />
characteristics for different dust resistivities. The dust<br />
thickness is 0.1 cm. The characteristics were made in a<br />
model ESP into laboratory [3].<br />
Figure 4. The current‐voltage characteristics as function of<br />
dust resistivity<br />
Figure 3. Secondary current as function of secondary<br />
voltage in case of back Corona discharges<br />
The back Corona density J b may be computed with:<br />
J<br />
( E − E ) 2<br />
0.4<br />
b = kb<br />
⋅ I ⋅ l t<br />
(1)<br />
where k b is the power of the particle layer thickness, E l<br />
is the average electric field in the layer, and E t is the<br />
average electric threshold.<br />
The average electric field in the layer depends on<br />
resistivity of the dust ρ, and current density J:<br />
For high resistance dust (over 1⋅10 11 Ω⋅cm) the slope of<br />
i‐u curve is infinite that indicates the back Corona<br />
discharges.<br />
The dust resistivity strongly influences the currentvoltage<br />
characteristics. The thicknesses of the dust<br />
modify the current‐voltage characteristics. In Figure 5<br />
the dust resistivity is 6⋅10 10 Ω⋅cm.<br />
The thicknesses of dust layer increase the current<br />
from source. For high value of the voltage, the i‐u<br />
curve is spreads. The computed and experimental<br />
characteristics are likewise.<br />
94<br />
2012. Fascicule 2 [April–June]


