

Editorial & Advisory Board - Acta Technica Corviniensis
Editorial & Advisory Board - Acta Technica Corviniensis
Editorial & Advisory Board - Acta Technica Corviniensis

Create successful ePaper yourself
Turn your PDF publications into a flip-book with our unique Google optimized e-Paper software.
ACTA TECHNICA CORVINIENSIS – Bulletin of Engineering<br />
600<br />
500<br />
400<br />
300<br />
200<br />
100<br />
Figure 9: Spray Formation Stages<br />
with Regarding to Fluid Swirl<br />
Figure 10: Fully Opened Spray Cone Under<br />
design conditions (P f =10, P o =4 bar)<br />
0<br />
0 5 10 15 20 25 30<br />
Figure 13: Spray distribution of the injector<br />
in each cylinder<br />
To obtain a symmetrical distribution of injection, the<br />
machining and drilling processes must be precise and<br />
accurate. Figures 12 and 13 show the spray distribution<br />
in each compartment of the collector [8].<br />
MICROSCOPIC SPRAY DROPLET TEST<br />
Using PDPA (Phase Doppler particle analyzer) laser<br />
laboratory, the microscopic characteristics of the<br />
injector spray have been identified [9]. As shown in<br />
figure 14 phase Doppler particle analyzing system<br />
consists of a laser light source, optical arrangements, a<br />
transmitter, and a data acquisition system. The<br />
visualization system used in this experiment consists<br />
of a laser source, lenses and mirrors, a high‐pressure<br />
spray chamber, and CCD camera [10].<br />
Figure 14: View of laser beams emitted to the spray<br />
Figure 11: Spray cone angle of (a) internal<br />
and (b) External nozzle<br />
SPRAY DISTRIBUTION AND HOMOGENEITY TEST<br />
Sectional and radial collectors are used to check the<br />
symmetry of the fluid spray [7].<br />
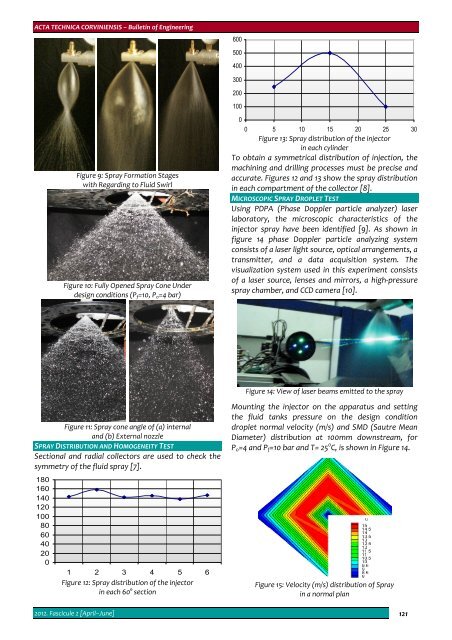
Mounting the injector on the apparatus and setting<br />
the fluid tanks pressure on the design condition<br />
droplet normal velocity (m/s) and SMD (Sautre Mean<br />
Diameter) distribution at 100mm downstream, for<br />
P o =4 and P f =10 bar and T= 25 0 C, is shown in Figure 14.<br />
180<br />
160<br />
140<br />
120<br />
100<br />
80<br />
60<br />
40<br />
20<br />
0<br />
1 2 3 4 5 6<br />
Figure 12: Spray distribution of the injector<br />
in each 60° section<br />
Figure 15: Velocity (m/s) distribution of Spray<br />
in a normal plan<br />
2012. Fascicule 2 [April–June] 121


