

Editorial & Advisory Board - Acta Technica Corviniensis
Editorial & Advisory Board - Acta Technica Corviniensis
Editorial & Advisory Board - Acta Technica Corviniensis

You also want an ePaper? Increase the reach of your titles
YUMPU automatically turns print PDFs into web optimized ePapers that Google loves.
ACTA TECHNICA CORVINIENSIS – Bulletin of Engineering<br />
frame and from the analysis the relationship between<br />
both shear and top displacement is plotted. From this<br />
relationship the maximum loop is adopted to calculate<br />
the parameters of the ductility factor as shown in<br />
Figure 6 for the figure the ductility factor can be given<br />
as follows:‐<br />
E<br />
n<br />
μ<br />
n<br />
= + 1 ( 1 )<br />
P . X<br />
Figure 6. Lateral drift‐ Base shear relationship (Max. excursion)<br />
where, E n =total max. hysteretic energy= E n + +E n<br />
‐<br />
P y and X y are as given by Figure 3.<br />
Also the Q‐factor for moment resisting steel frame can<br />
be computed as given by Euro code 8 as: Q=5.0*μ<br />
which expresses the elastic behaviour of the frame<br />
under the effect of seismic actions.<br />
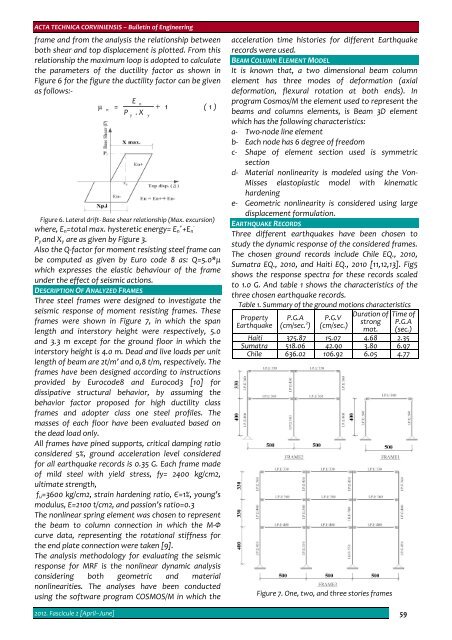
DESCRIPTION OF ANALYZED FRAMES<br />
Three steel frames were designed to investigate the<br />
seismic response of moment resisting frames. These<br />
frames were shown in Figure 7, in which the span<br />
length and interstory height were respectively, 5.0<br />
and 3.3 m except for the ground floor in which the<br />
interstory height is 4.0 m. Dead and live loads per unit<br />
length of beam are 2t/m’ and 0,8 t/m, respectively. The<br />
frames have been designed according to instructions<br />
provided by Eurocode8 and Eurocod3 [10] for<br />
dissipative structural behavior, by assuming the<br />
behavior factor proposed for high ductility class<br />
frames and adopter class one steel profiles. The<br />
masses of each floor have been evaluated based on<br />
the dead load only.<br />
All frames have pined supports, critical damping ratio<br />
considered 5%, ground acceleration level considered<br />
for all earthquake records is 0.35 G. Each frame made<br />
of mild steel with yield stress, fy= 2400 kg/cm2,<br />
ultimate strength,<br />
f u =3600 kg/cm2, strain hardening ratio, Є=1%, young’s<br />
modulus, E=2100 t/cm2, and passion’s ratio=0.3<br />
The nonlinear spring element was chosen to represent<br />
the beam to column connection in which the M‐Ф<br />
curve data, representing the rotational stiffness for<br />
the end plate connection were taken [9].<br />
The analysis methodology for evaluating the seismic<br />
response for MRF is the nonlinear dynamic analysis<br />
considering both geometric and material<br />
nonlinearities. The analyses have been conducted<br />
using the software program COSMOS/M in which the<br />
y<br />
y<br />
acceleration time histories for different Earthquake<br />
records were used.<br />
BEAM COLUMN ELEMENT MODEL<br />
It is known that, a two dimensional beam column<br />
element has three modes of deformation (axial<br />
deformation, flexural rotation at both ends). In<br />
program Cosmos/M the element used to represent the<br />
beams and columns elements, is Beam 3D element<br />
which has the following characteristics:<br />
a‐ Two‐node line element<br />
b‐ Each node has 6 degree of freedom<br />
c‐ Shape of element section used is symmetric<br />
section<br />
d‐ Material nonlinearity is modeled using the Von‐<br />
Misses elastoplastic model with kinematic<br />
hardening<br />
e‐ Geometric nonlinearity is considered using large<br />
displacement formulation.<br />
EARTHQUAKE RECORDS<br />
Three different earthquakes have been chosen to<br />
study the dynamic response of the considered frames.<br />
The chosen ground records include Chile EQ., 2010,<br />
Sumatra EQ., 2010, and Haiti EQ., 2010 [11,12,13]. Fig5<br />
shows the response spectra for these records scaled<br />
to 1.0 G. And table 1 shows the characteristics of the<br />
three chosen earthquake records.<br />
Table 1. Summary of the ground motions characteristics<br />
Property<br />
Earthquake<br />
Haiti<br />
Sumatra<br />
Chile<br />
P.G.A<br />
(cm/sec. 2 )<br />
375.87<br />
518.06<br />
636.02<br />
P.G.V<br />
(cm/sec.)<br />
15.07<br />
42.90<br />
106.92<br />
Duration of<br />
strong<br />
mot.<br />
4.68<br />
3.80<br />
6.05<br />
Figure 7. One, two, and three stories frames<br />
Time of<br />
P.G.A<br />
(sec.)<br />
2.35<br />
6.97<br />
4.77<br />
2012. Fascicule 2 [April–June] 59


