

Editorial & Advisory Board - Acta Technica Corviniensis
Editorial & Advisory Board - Acta Technica Corviniensis
Editorial & Advisory Board - Acta Technica Corviniensis

Create successful ePaper yourself
Turn your PDF publications into a flip-book with our unique Google optimized e-Paper software.
ACTA TECHNICA CORVINIENSIS – Bulletin of Engineering<br />
Figure 2 GUI displaying Bode plots of frequency domain<br />
analysis for PID controller<br />
32<br />
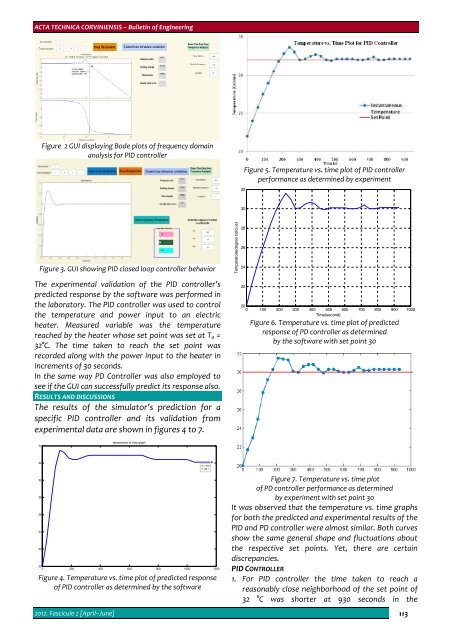
Figure 5. Temperature vs. time plot of PID controller<br />
performance as determined by experiment<br />
30<br />
Figure 3. GUI showing PID closed loop controller behavior<br />
The experimental validation of the PID controller’s<br />
predicted response by the software was performed in<br />
the laboratory. The PID controller was used to control<br />
the temperature and power input to an electric<br />
heater. Measured variable was the temperature<br />
reached by the heater whose set point was set at T 0 =<br />
32°C. The time taken to reach the set point was<br />
recorded along with the power input to the heater in<br />
increments of 30 seconds.<br />
In the same way PD Controller was also employed to<br />
see if the GUI can successfully predict its response also.<br />
RESULTS AND DISCUSSIONS<br />
The results of the simulator’s prediction for a<br />
specific PID controller and its validation from<br />
experimental data are shown in figures 4 to 7.<br />
Temperature(degree celcius)<br />
28<br />
26<br />
24<br />
22<br />
20<br />
0 100 200 300 400 500 600 700 800 900 1000<br />
Time(second)<br />
Figure 6. Temperature vs. time plot of predicted<br />
response of PD controller as determined<br />
by the software with set point 30<br />
34<br />
temperature vs time graph<br />
32<br />
30<br />
28<br />
26<br />
24<br />
22<br />
20<br />
0 200 400 600 800 1000 1200<br />
Figure 4. Temperature vs. time plot of predicted response<br />
of PID controller as determined by the software<br />
X: 1170<br />
Y: 32.1<br />
Figure 7. Temperature vs. time plot<br />
of PD controller performance as determined<br />
by experiment with set point 30<br />
It was observed that the temperature vs. time graphs<br />
for both the predicted and experimental results of the<br />
PID and PD controller were almost similar. Both curves<br />
show the same general shape and fluctuations about<br />
the respective set points. Yet, there are certain<br />
discrepancies.<br />
PID CONTROLLER<br />
1. For PID controller the time taken to reach a<br />
reasonably close neighborhood of the set point of<br />
32 °C was shorter at 930 seconds in the<br />
2012. Fascicule 2 [April–June] 113


