

Editorial & Advisory Board - Acta Technica Corviniensis
Editorial & Advisory Board - Acta Technica Corviniensis
Editorial & Advisory Board - Acta Technica Corviniensis

You also want an ePaper? Increase the reach of your titles
YUMPU automatically turns print PDFs into web optimized ePapers that Google loves.
ACTA TECHNICA CORVINIENSIS – Bulletin of Engineering<br />
The values of uncertainty of average corrected<br />
temperature T kor , measured with pyrometer at one<br />
level, expressed as relative expanded uncertainty U rel<br />
(k = 2) illustrates Figure 2. The uncertainty of<br />
pyrometer is 3 to 6 times more than uncertainty of<br />
standard.<br />
MEASUREMENT SYSTEMS ANALYSIS<br />
In addition to analysis of uncertainty the quality of<br />
measurement process was evaluated by<br />
“Measurement systems analysis” (MSA). This method<br />
is not standardized yet, but is recommended in the<br />
reference manuals, used the first of all in the<br />
automotive industry. MSA helps conform to ISO/TS<br />
16 949:2002 requirements as well as AIAG standards.<br />
It is an experimental and mathematical method of<br />
determining how much the variation within the<br />
measurement process contributes to overall process<br />
variability. The measurement process, running in<br />
capable measurement system (consists of<br />
measurement equipment, samples, environment,<br />
method, appraisers…) is capable as well.<br />
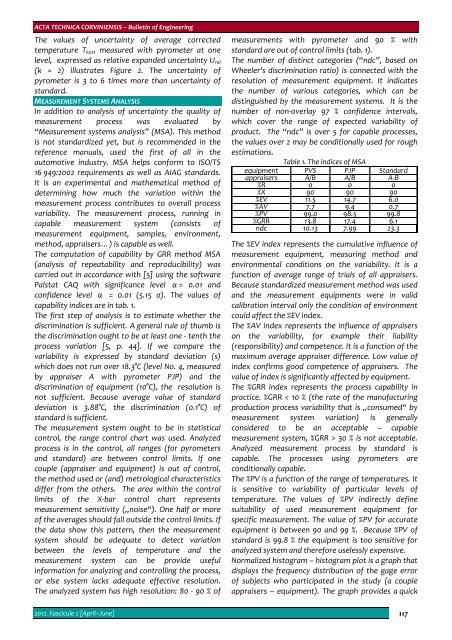
The computation of capability by GRR method MSA<br />
(analysis of repeatability and reproducibility) was<br />
carried out in accordance with [5] using the software<br />
Palstat CAQ with significance level α = 0.01 and<br />
confidence level α = 0.01 (5.15 σ). The values of<br />
capability indices are in tab. 1.<br />
The first step of analysis is to estimate whether the<br />
discrimination is sufficient. A general rule of thumb is<br />
the discrimination ought to be at least one ‐ tenth the<br />
process variation [5, p. 44]. If we compare the<br />
variability is expressed by standard deviation (s)<br />
which does not run over 18.3°C (level No. 4, measured<br />
by appraiser A with pyrometer PJP) and the<br />
discrimination of equipment (10°C), the resolution is<br />
not sufficient. Because average value of standard<br />
deviation is 3.88°C, the discrimination (0.1°C) of<br />
standard is sufficient.<br />
The measurement system ought to be in statistical<br />
control, the range control chart was used. Analyzed<br />
process is in the control, all ranges (for pyrometers<br />
and standard) are between control limits. If one<br />
couple (appraiser and equipment) is out of control,<br />
the method used or (and) metrological characteristics<br />
differ from the others. The area within the control<br />
limits of the X‐bar control chart represents<br />
measurement sensitivity („noise“). One half or more<br />
of the averages should fall outside the control limits. If<br />
the data show this pattern, then the measurement<br />
system should be adequate to detect variation<br />
between the levels of temperature and the<br />
measurement system can be provide useful<br />
information for analyzing and controlling the process,<br />
or else system lacks adequate effective resolution.<br />
The analyzed system has high resolution: 80 ‐ 90 % of<br />
measurements with pyrometer and 90 % with<br />
standard are out of control limits (tab. 1).<br />
The number of distinct categories (“ndc”, based on<br />
Wheeler's discrimination ratio) is connected with the<br />
resolution of measurement equipment. It indicates<br />
the number of various categories, which can be<br />
distinguished by the measurement systems. It is the<br />
number of non‐overlay 97 % confidence intervals,<br />
which cover the range of expected variability of<br />
product. The “ndc” is over 5 for capable processes,<br />
the values over 2 may be conditionally used for rough<br />
estimations.<br />
Table 1. The indices of MSA<br />
equipment PVS PJP Standard<br />
appraisers A/B A/B A‐B<br />
%R 0 0 0<br />
%X 90 90 90<br />
%EV 11.5 14.7 6.0<br />
%AV 7.7 9.4 0.7<br />
%PV 99.0 98.5 99.8<br />
%GRR 13.8 17.4 6.1<br />
ndc 10.13 7.99 23.3<br />
The %EV index represents the cumulative influence of<br />
measurement equipment, measuring method and<br />
environmental conditions on the variability. It is a<br />
function of average range of trials of all appraisers.<br />
Because standardized measurement method was used<br />
and the measurement equipments were in valid<br />
calibration interval only the condition of environment<br />
could affect the %EV index.<br />
The %AV index represents the influence of appraisers<br />
on the variability, for example their liability<br />
(responsibility) and competence. It is a function of the<br />
maximum average appraiser difference. Low value of<br />
index confirms good competence of appraisers. The<br />
value of index is significantly affected by equipment.<br />
The %GRR index represents the process capability in<br />
practice. %GRR < 10 % (the rate of the manufacturing<br />
production process variability that is „consumed“ by<br />
measurement system variation) is generally<br />
considered to be an acceptable – capable<br />
measurement system, %GRR > 30 % is not acceptable.<br />
Analyzed measurement process by standard is<br />
capable. The processes using pyrometers are<br />
conditionally capable.<br />
The %PV is a function of the range of temperatures. It<br />
is sensitive to variability of particular levels of<br />
temperature. The values of %PV indirectly define<br />
suitability of used measurement equipment for<br />
specific measurement. The value of %PV for accurate<br />
equipment is between 90 and 99 %. Because %PV of<br />
standard is 99.8 % the equipment is too sensitive for<br />
analyzed system and therefore uselessly expensive.<br />
Normalized histogram – histogram plot is a graph that<br />
displays the frequency distribution of the gage error<br />
of subjects who participated in the study (a couple<br />
appraisers – equipment). The graph provides a quick<br />
2012. Fascicule 2 [April–June] 117


