

Editorial & Advisory Board - Acta Technica Corviniensis
Editorial & Advisory Board - Acta Technica Corviniensis
Editorial & Advisory Board - Acta Technica Corviniensis

Create successful ePaper yourself
Turn your PDF publications into a flip-book with our unique Google optimized e-Paper software.
ACTA TECHNICA CORVINIENSIS – Bulletin of Engineering<br />
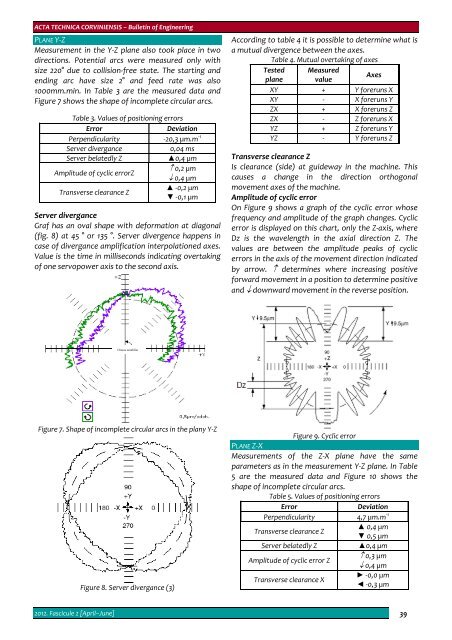
PLANE Y‐Z<br />
Measurement in the Y‐Z plane also took place in two<br />
directions. Potential arcs were measured only with<br />
size 220° due to collision‐free state. The starting and<br />
ending arc have size 2° and feed rate was also<br />
1000mm.min. In Table 3 are the measured data and<br />
Figure 7 shows the shape of incomplete circular arcs.<br />
Table 3. Values of positioning errors<br />
Error<br />
Deviation<br />
Perpendicularity ‐20,3 µm.m ‐1<br />
Server divergance<br />
0,04 ms<br />
Server belatedly Z ▲0,4 µm<br />
Amplitude of cyclic errorZ<br />
↑ 0,2 µm<br />
↓ 0,4 µm<br />
Transverse clearance Z<br />
▲ ‐0,2 µm<br />
▼ ‐0,1 µm<br />
Server divergance<br />
Graf has an oval shape with deformation at diagonal<br />
(fig. 8) at 45 ° or 135 °. Server divergence happens in<br />
case of divergance amplification interpolationed axes.<br />
Value is the time in milliseconds indicating overtaking<br />
of one servopower axis to the second axis.<br />
According to table 4 it is possible to determine what is<br />
a mutual divergence between the axes.<br />
Table 4. Mutual overtaking of axes<br />
Tested Measured<br />
plane value<br />
Axes<br />
XY + Y foreruns X<br />
XY ‐ X foreruns Y<br />
ZX + X foreruns Z<br />
ZX ‐ Z foreruns X<br />
YZ + Z foreruns Y<br />
YZ ‐ Y foreruns Z<br />
Transverse clearance Z<br />
Is clearance (side) at guideway in the machine. This<br />
causes a change in the direction orthogonal<br />
movement axes of the machine.<br />
Amplitude of cyclic error<br />
On Figure 9 shows a graph of the cyclic error whose<br />
frequency and amplitude of the graph changes. Cyclic<br />
error is displayed on this chart, only the Z‐axis, where<br />
Dz is the wavelength in the axial direction Z. The<br />
values are between the amplitude peaks of cyclic<br />
errors in the axis of the movement direction indicated<br />
by arrow. ↑ determines where increasing positive<br />
forward movement in a position to determine positive<br />
and ↓ downward movement in the reverse position.<br />
Charge amplifier<br />
Figure 7. Shape of incomplete circular arcs in the plany Y‐Z<br />
Figure 8. Server divergance (3)<br />
Figure 9. Cyclic error<br />
PLANE Z‐X<br />
Measurements of the Z‐X plane have the same<br />
parameters as in the measurement Y‐Z plane. In Table<br />
5 are the measured data and Figure 10 shows the<br />
shape of incomplete circular arcs.<br />
Table 5. Values of positioning errors<br />
Error<br />
Deviation<br />
Perpendicularity 4,7 µm.m ‐1<br />
▲ 0,4 µm<br />
Transverse clearance Z<br />
▼ 0,5 µm<br />
Server belatedly Z ▲0,4 µm<br />
↑ 0,3 µm<br />
Amplitude of cyclic error Z<br />
↓ 0,4 µm<br />
► ‐0,0 µm<br />
Transverse clearance X<br />
◄ ‐0,3 µm<br />
2012. Fascicule 2 [April–June] 39


