

Editorial & Advisory Board - Acta Technica Corviniensis
Editorial & Advisory Board - Acta Technica Corviniensis
Editorial & Advisory Board - Acta Technica Corviniensis

Create successful ePaper yourself
Turn your PDF publications into a flip-book with our unique Google optimized e-Paper software.
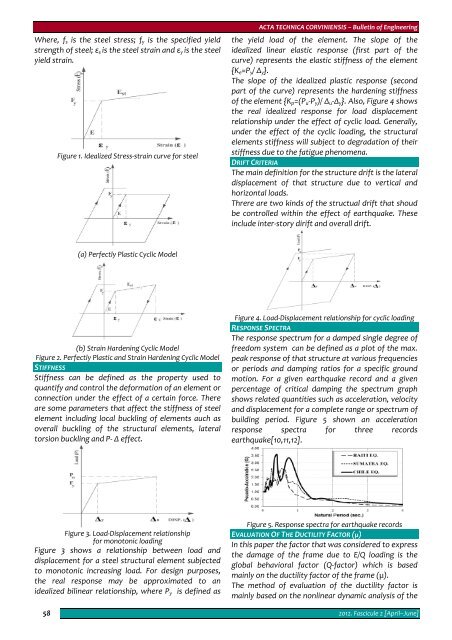
Where, f s is the steel stress; f y is the specified yield<br />
strength of steel; ε s is the steel strain and ε y is the steel<br />
yield strain.<br />
Figure 1. Idealized Stress‐strain curve for steel<br />
ACTA TECHNICA CORVINIENSIS – Bulletin of Engineering<br />
the yield load of the element. The slope of the<br />
idealized linear elastic response (first part of the<br />
curve) represents the elastic stiffness of the element<br />
{K e =P y / Δ y }.<br />
The slope of the idealized plastic response (second<br />
part of the curve) represents the hardening stiffness<br />
of the element {K p =(P u ‐P y )/ Δ u ‐Δ y }. Also, Figure 4 shows<br />
the real idealized response for load displacement<br />
relationship under the effect of cyclic load. Generally,<br />
under the effect of the cyclic loading, the structural<br />
elements stiffness will subject to degradation of their<br />
stiffness due to the fatigue phenomena.<br />
DRIFT CRITERIA<br />
The main definition for the structure drift is the lateral<br />
displacement of that structure due to vertical and<br />
horizontal loads.<br />
Threre are two kinds of the structual drift that shoud<br />
be controlled within the effect of earthquake. These<br />
include inter‐story dirift and overall drift.<br />
(a) Perfectly Plastic Cyclic Model<br />
(b) Strain Hardening Cyclic Model<br />
Figure 2. Perfectly Plastic and Strain Hardening Cyclic Model<br />
STIFFNESS<br />
Stiffness can be defined as the property used to<br />
quantify and control the deformation of an element or<br />
connection under the effect of a certain force. There<br />
are some parameters that affect the stiffness of steel<br />
element including local buckling of elements auch as<br />
overall buckling of the structural elements, lateral<br />
torsion buckling and P‐ Δ effect.<br />
Figure 4. Load‐Displacement relationship for cyclic loading<br />
RESPONSE SPECTRA<br />
The response spectrum for a damped single degree of<br />
freedom system can be defined as a plot of the max.<br />
peak response of that structure at various frequencies<br />
or periods and damping ratios for a specific ground<br />
motion. For a given earthquake record and a given<br />
percentage of critical damping the spectrum graph<br />
shows related quantities such as acceleration, velocity<br />
and displacement for a complete range or spectrum of<br />
building period. Figure 5 shown an acceleration<br />
response spectra for three records<br />
earthquake[10,11,12].<br />
Figure 3. Load‐Displacement relationship<br />
for monotonic loading<br />
Figure 3 shows a relationship between load and<br />
displacement for a steel structural element subjected<br />
to monotonic increasing load. For design purposes,<br />
the real response may be approximated to an<br />
idealized bilinear relationship, where P y is defined as<br />
58<br />
Figure 5. Response spectra for earthquake records<br />
EVALUATION OF THE DUCTILITY FACTOR (µ)<br />
In this paper the factor that was considered to express<br />
the damage of the frame due to E/Q loading is the<br />
global behavioral factor (Q‐factor) which is based<br />
mainly on the ductility factor of the frame (µ).<br />
The method of evaluation of the ductility factor is<br />
mainly based on the nonlinear dynamic analysis of the<br />
2012. Fascicule 2 [April–June]


