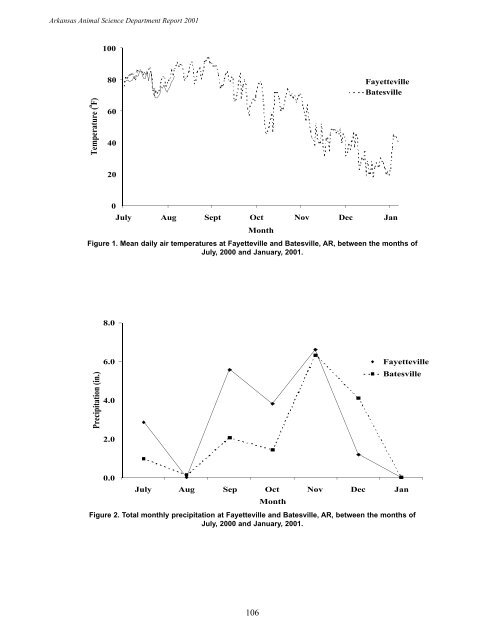
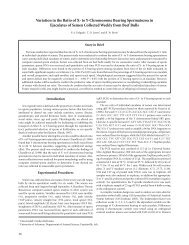
<strong>Arkansas</strong> Animal Science Department Report 2001 100 80 Fayetteville Batesville Temperature ( o F) 60 40 20 0 July Aug Sept Oct Nov Dec Jan Month Figure 1. Mean daily air temperatures at Fayetteville and Batesville, AR, between the months <strong>of</strong> July, 2000 and January, 2001. 8.0 Precipitation (in.) 6.0 4.0 Fayetteville Batesville 2.0 0.0 July Aug Sep Oct Nov Dec Jan Month Figure 2. Total monthly precipitation at Fayetteville and Batesville, AR, between the months <strong>of</strong> July, 2000 and January, 2001. 106
Effects <strong>of</strong> Nitrogen Fertilization on Subsequent Partitioning <strong>of</strong> Nitrogen in Cell Wall and Cell Soluble Fractions in Bermudagrass Forages W. K. Coblentz, 1 J. L. Gunsaulis, 2 M. B Daniels, 3 J. E. Turner, 1 D. A. Scarbrough, 1 J. B. Humphry, 1 K. P. C<strong>of</strong>fey, 1 K. A. Teague, 2 J. D. Speight, 2 and M. R. Gross 2 Story in Brief Estimates <strong>of</strong> rumen degradable or escape N are an important component <strong>of</strong> current nutritional models for feeding livestock. One factor that can affect the proportion <strong>of</strong> forage nitrogen (N) that bypasses the rumen intact is the relative proportion <strong>of</strong> total plant N that is associated with the cell wall. Relatively little is known about this characteristic <strong>of</strong> N within bermudagrass [Cynodon dactylon (L.) Pers.] forages, and the effects <strong>of</strong> fertilization with N have not been evaluated in depth. The objective <strong>of</strong> this study was to assess the relationship between N fertilization rate and the relative proportions <strong>of</strong> plant N partitioned into the cell solubles and cell wall. Bermudagrass at two sites was fertilized in split applications with 0, 50, 100, or 150 lb N/acre as ammonium nitrate such that the total applications for the year were 0, 50, 100, 150, 200, 250, or 300 lb N/acre. Plots were harvested on three dates (May 30, July 7, and August 18). Based on results for the entire year (three harvests), concentrations <strong>of</strong> N in the forage increased linearly (P < 0.0001) with fertilization rate at both sites. Concentrations <strong>of</strong> cell-soluble N (NDSN) also increased linearly (P ≤ 0.023) with fertilization rate; however, the magnitude <strong>of</strong> change was relatively small (≤ 4.3 percentage units <strong>of</strong> the total plant N pool). Conversely, the percentage <strong>of</strong> total plant N associated with the cell wall (NDIN) declined in a linear pattern (P ≤ 0.023) in response to fertilization with N. Concentrations <strong>of</strong> acid-detergent insoluble N (ADIN) also decreased linearly (P < 0.001) with N fertilization rate, thereby suggesting that bioavailability may be slightly improved with fertilization. Introduction Bermudagrass has been described for more than a century as one <strong>of</strong> the most important grasses grown in the southeastern US. This warm-season grass is used widely by beef and dairy producers for both grazing and hay production throughout this region. Many current nutritional models for ruminants require knowledge <strong>of</strong> the rumen degradable N concentration in forages (NRC, 2000; Sniffen et al., 1992), and diets are currently balanced on this basis. One factor that affects the relative proportion <strong>of</strong> plant N that escapes ruminal degradation is the proportion <strong>of</strong> plant N that is associated with the cell wall (NDIN). Fertilization with N is known to increase concentrations <strong>of</strong> total N in bermudagrass, but it remains unclear how this N is partitioned within the plant. Most cell soluble N (NDSN) should be available to rumen microorganisms; however, NDIN is likely to have reduced availability in the rumen. The N that is insoluble in acid detergent (ADIN) typically has little or no bioavailability. The objective <strong>of</strong> this study was to assess the relationship between N fertilization rate and the relative proportions <strong>of</strong> plant N that are partitioned into the NDSN, NDIN, and ADIN fractions. Materials and Methods Generation <strong>of</strong> Sample Sets. Twenty-eight 10-ft x 20-ft plots were established on two producer farms (Latta and Stephens) located near Lincoln, AR in the early spring <strong>of</strong> 2000. Both sites had histories <strong>of</strong> poultry waste application. Poultry waste was applied during the previous year (1999) at the Latta site only. Concentrations <strong>of</strong> soil-test P were 305 and 571 lb/acre at the Stephens and Latta sites, respectively. The associated levels <strong>of</strong> soil-test K at these sites were 137 and 496 lb/acre. These sites are representative <strong>of</strong> many in northwestern <strong>Arkansas</strong> that have histories <strong>of</strong> intermittent or annual applications <strong>of</strong> poultry waste. Nitrogen was applied as ammonium nitrate (34-0-0) in split applications <strong>of</strong> 0, 50, 100, and 150 lb N/acre on April 28 and July 19. For the year, N fertilizer was applied at cumulative rates <strong>of</strong> 0, 50, 100, 150, 200, 250, and 300 lb N/acre as shown in Table 1. Plots at each site were arranged in a randomized complete block design with four replications. Plots were clipped to a 2-in. stubble height on May 30, July 7, and August 18 with a sickle-bar mower and representative subsamples were retained for laboratory analysis. The extremely droughty conditions in <strong>Arkansas</strong> during the late summer <strong>of</strong> 2000 prevented a final (fourth) harvest in early fall. 1 Department <strong>of</strong> Animal Science, Fayetteville. 2 Cooperative Extension Service, Washington County Office, Fayetteville. 3 Cooperative Extension Service, Environmental and Natural Resources Section, Little Rock. 107