

2007 Benchmarking Report - Alliance for Biking & Walking
2007 Benchmarking Report - Alliance for Biking & Walking
2007 Benchmarking Report - Alliance for Biking & Walking

You also want an ePaper? Increase the reach of your titles
YUMPU automatically turns print PDFs into web optimized ePapers that Google loves.
City<br />
Census 2000 %<br />
bike to work<br />
Census 2000<br />
ranking<br />
ACS 2005 %<br />
bike to work<br />
ACS 2005<br />
ranking<br />
Census 2000 %<br />
walk to work<br />
Census 2000<br />
Ranking<br />
ACS 2005 %<br />
walk to work<br />
Mesa 1.23% 8 0.75 16 2.08% 38 2.08% 27<br />
Miami 0.55% 23 0.53 27 3.67% 18 4.87% 11<br />
Milwaukee 0.33% 32 0.57 25 4.71% 13 4.27% 14<br />
Minneapolis 1.89% 3 2.42 2 6.61% 8 5.81% 8<br />
Nashville 0.14% 44 0.17 42 2.38% 30 1.87% 32<br />
New Orleans 1.16% 11 0.97 12 5.21% 12 4.22% 16<br />
New York 0.47% 26 0.48 29 10.41% 3 9.44% 4<br />
Oakland 1.22% 9 1.54 8 3.73% 17 2.98% 21<br />
Oklahoma City 0.11% 50 0.17 43 1.59% 48 1.36% 47<br />
Omaha 0.14% 45 0.12 47 2.37% 31 2.12% 26<br />
Philadelphia 0.86% 16 0.89 14 9.05% 5 8.05% 5<br />
Phoenix 0.86% 17 0.60 22 2.17% 36 1.62% 41<br />
Portland 1.76% 5 3.47 1 5.24% 11 4.30% 13<br />
Sacramento 1.35% 6 1.75 6 2.77% 25 3.66% 17<br />
San Antonio 0.16% 40 0.13 46 2.17% 35 1.49% 45<br />
San Diego 0.73% 20 0.62 20 3.65% 19 1.89% 30<br />
San Francisco 1.98% 2 1.85 5 9.36% 4 9.59% 3<br />
San Jose 0.62% 21 0.40 30 1.44% 50 1.52% 44<br />
Seattle 1.88% 4 2.31 3 7.36% 6 6.87% 7<br />
Tucson 2.21% 1 2.24 4 3.44% 22 3.11% 20<br />
Tulsa 0.21% 38 0.26 37 2.24% 34 1.96% 29<br />
Virginia Beach 0.32% 34 0.56 26 1.96% 41 1.56% 43<br />
Washington 1.16% 10 1.74 7 11.80% 2 9.97% 2<br />
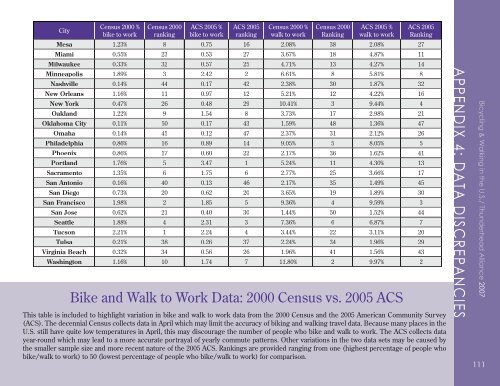
Bike and Walk to Work Data: 2000 Census vs. 2005 ACS<br />
ACS 2005<br />
Ranking<br />
This table is included to highlight variation in bike and walk to work data from the 2000 Census and the 2005 American Community Survey<br />
(ACS). The decennial Census collects data in April which may limit the accuracy of biking and walking travel data. Because many places in the<br />
U.S. still have quite low temperatures in April, this may discourage the number of people who bike and walk to work. The ACS collects data<br />
year-round which may lead to a more accurate portrayal of yearly commute patterns. Other variations in the two data sets may be caused by<br />
the smaller sample size and more recent nature of the 2005 ACS. Rankings are provided ranging from one (highest percentage of people who<br />
bike/walk to work) to 50 (lowest percentage of people who bike/walk to work) <strong>for</strong> comparison.<br />
APPENDIX 4: DATA DISCREPANCIES<br />
Bicycling & <strong>Walking</strong> in the U.S./ Thunderhead <strong>Alliance</strong> <strong>2007</strong><br />
111
