2007 Benchmarking Report - Alliance for Biking & Walking
2007 Benchmarking Report - Alliance for Biking & Walking
2007 Benchmarking Report - Alliance for Biking & Walking
Create successful ePaper yourself
Turn your PDF publications into a flip-book with our unique Google optimized e-Paper software.
anks lowest here with only 4.0% walking mode share. People in<br />
major cities are 1.8 times more likely to walk to work than their<br />
counterparts nationwide, according to ACS data. Using NHTS<br />
estimates <strong>for</strong> all trips by cities, New York City ranks highest with<br />
19.2% of trips estimated to be by foot. Louisville and Houston<br />
rank lowest with an estimated 4.5% walking mode share.<br />
Who Walks<br />
Data on pedestrian demographics have the same limitations<br />
as with cyclists (outlined in Chapter 3). For this report,<br />
ACS and NHTS data provided demographic in<strong>for</strong>mation including<br />
sex, ethnicity and income levels of pedestrians. There is significantly<br />
less difference in the male to female sex ratio among<br />
pedestrians compared to cyclists. Although on average, men are<br />
still more likely to walk than women (55% of walking trips are<br />
by men), the gap between the sexes is much smaller than with<br />
cycling.<br />
The ethnicity gap, however, is much greater among<br />
pedestrians than cyclists. Among non-white workers, 3.6% walk<br />
to work. This makes non-whites 1.3 times more likely to walk to<br />
work than the average person. The differences in income levels<br />
of pedestrians are also more striking than among cyclists. In all<br />
states, at least 60% of pedestrians earn $35,000 per year or less.<br />
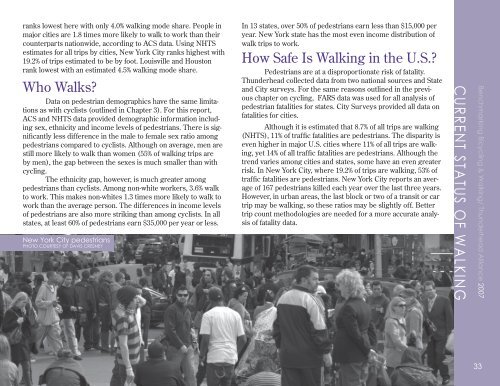
New York City pedestrians<br />
PHOTO COURTESY OF DAVIS CRESNEY<br />
In 13 states, over 50% of pedestrians earn less than $15,000 per<br />
year. New York state has the most even income distribution of<br />
walk trips to work.<br />
How Safe Is <strong>Walking</strong> in the U.S.<br />
Pedestrians are at a disproportionate risk of fatality.<br />
Thunderhead collected data from two national sources and State<br />
and City surveys. For the same reasons outlined in the previous<br />
chapter on cycling, FARS data was used <strong>for</strong> all analysis of<br />
pedestrian fatalities <strong>for</strong> states. City Surveys provided all data on<br />
fatalities <strong>for</strong> cities.<br />
Although it is estimated that 8.7% of all trips are walking<br />
(NHTS), 11% of traffic fatalities are pedestrians. The disparity is<br />
even higher in major U.S. cities where 11% of all trips are walking,<br />
yet 14% of all traffic fatalities are pedestrians. Although the<br />
trend varies among cities and states, some have an even greater<br />
risk. In New York City, where 19.2% of trips are walking, 53% of<br />
traffic fatalities are pedestrians. New York City reports an average<br />
of 167 pedestrians killed each year over the last three years.<br />
However, in urban areas, the last block or two of a transit or car<br />
trip may be walking, so these ratios may be slightly off. Better<br />
trip count methodologies are needed <strong>for</strong> a more accurate analysis<br />
of fatality data.<br />
CURRENT STATUS OF WALKING<br />
<strong>Benchmarking</strong> Bicycling & Bicycling <strong>Walking</strong> & in <strong>Walking</strong>/ the U.S./ Thunderhead <strong>Alliance</strong> <strong>2007</strong><br />
33


