

2007 Benchmarking Report - Alliance for Biking & Walking
2007 Benchmarking Report - Alliance for Biking & Walking
2007 Benchmarking Report - Alliance for Biking & Walking

You also want an ePaper? Increase the reach of your titles
YUMPU automatically turns print PDFs into web optimized ePapers that Google loves.
Bicycling & <strong>Walking</strong> in the U.S./ Thunderhead <strong>Alliance</strong> <strong>2007</strong><br />
94<br />
IMPACTS OF CYCLING & WALKING ON PUBLIC HEALTH<br />
Nutrition Examination Survey (NHANES) data on levels of<br />
biking and walking to school (McDonald, Noreen, <strong>2007</strong>) over<br />
a similar time period. The data demonstrate a parallel trend<br />
among school children in this time period. Levels of biking<br />
and walking to school declined sharply while childhood obesity<br />
levels sharply increased. During the period between 1966<br />
and 2001, the number of children who biked or walked to<br />
school fell 68%, while the percentage of obese children rose<br />
367%.<br />
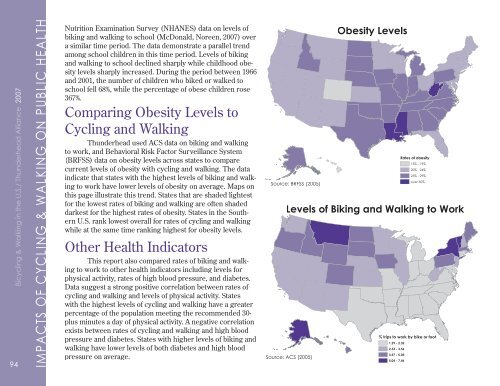
Comparing Obesity Levels to<br />
Cycling and <strong>Walking</strong><br />
Thunderhead used ACS data on biking and walking<br />
to work, and Behavioral Risk Factor Surveillance System<br />
(BRFSS) data on obesity levels across states to compare<br />
current levels of obesity with cycling and walking. The data<br />
indicate that states with the highest levels of biking and walking<br />
to work have lower levels of obesity on average. Maps on<br />
this page illustrate this trend. States that are shaded lightest<br />
<strong>for</strong> the lowest rates of biking and walking are often shaded<br />
darkest <strong>for</strong> the highest rates of obesity. States in the Southern<br />
U.S. rank lowest overall <strong>for</strong> rates of cycling and walking<br />
while at the same time ranking highest <strong>for</strong> obesity levels.<br />
Other Health Indicators<br />
This report also compared rates of biking and walking<br />
to work to other health indicators including levels <strong>for</strong><br />
physical activity, rates of high blood pressure, and diabetes.<br />
Data suggest a strong positive correlation between rates of<br />
cycling and walking and levels of physical activity. States<br />
with the highest levels of cycling and walking have a greater<br />
percentage of the population meeting the recommended 30-<br />
plus minutes a day of physical activity. A negative correlation<br />
exists between rates of cycling and walking and high blood<br />
pressure and diabetes. States with higher levels of biking and<br />
walking have lower levels of both diabetes and high blood<br />
pressure on average.<br />
Levels of <strong>Biking</strong> Trips and to Work<br />
<strong>Walking</strong> to Work<br />
Source: ACS 2005<br />
Obesity Rates<br />
Levels<br />
states<br />
Rates of obesity<br />
15% - 19%<br />
20% - 24%<br />
25% - 29%<br />
Source: BRFSS<br />
over 30%<br />
Source: BRFSS (2005)<br />
Source: ACS (2005)<br />
% trips to work by bike or foot<br />
1.29 - 2.32<br />
2.33 - 3.56<br />
3.57 - 5.03<br />
5.04 - 7.46
