

2007 Benchmarking Report - Alliance for Biking & Walking
2007 Benchmarking Report - Alliance for Biking & Walking
2007 Benchmarking Report - Alliance for Biking & Walking

Create successful ePaper yourself
Turn your PDF publications into a flip-book with our unique Google optimized e-Paper software.
Other<br />
Source: FHWA (2001-2006)<br />
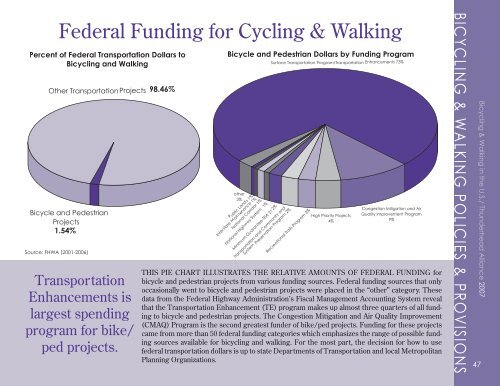
Federal Funding <strong>for</strong> Cycling & <strong>Walking</strong><br />
Percent of Federal Transportation Dollars to<br />
Bicycling and <strong>Walking</strong><br />
Transportation P rojects<br />
98.46% %<br />
Bicycle and Pedestrian<br />
Projects<br />
1.54% 2%<br />
Transportation<br />
Enhancements is<br />
largest spending<br />
program <strong>for</strong> bike/<br />
ped projects.<br />
Bicycle and Pedestrian Dollars by Funding Program<br />
other<br />
3%<br />
Surface Transportation<br />
Public Lands 1%<br />
Interstate<br />
Maintena nce 1%<br />
National Corridor 1%<br />
National Highway<br />
Sys tem 1%<br />
Minimum Guarantee-TEA 21 2%<br />
Transportation<br />
and Community<br />
and<br />
System<br />
Preservation Program 2%<br />
Recreational Trails<br />
Program 3%<br />
rogram/Transportation<br />
High Priority Projects<br />
4%<br />
THIS PIE CHART ILLUSTRATES THE RELATIVE AMOUNTS OF FEDERAL FUNDING <strong>for</strong><br />
bicycle and pedestrian projects from various funding sources. Federal funding sources that only<br />
occasionally went to bicycle and pedestrian projects were placed in the “other” category. These<br />
data from the Federal Highway Administration’s Fiscal Management Accounting System reveal<br />
that the Transportation Enhancement (TE) program makes up almost three quarters of all funding<br />
to bicycle and pedestrian projects. The Congestion Mitigation and Air Quality Improvement<br />
(CMAQ) Program is the second greatest funder of bike/ped projects. Funding <strong>for</strong> these projects<br />
came from more than 50 federal funding categories which emphasizes the range of possible funding<br />
sources available <strong>for</strong> bicycling and walking. For the most part, the decision <strong>for</strong> how to use<br />
federal transportation dollars is up to state Departments of Transportation and local Metropolitan<br />
Planning Organizations.<br />
P<br />
E nhancements<br />
73%<br />
Congestion Mitigation and Air<br />
Quality Improvement Program<br />
9%<br />
BICYCLING & WALKING POLICIES & PROVISIONS<br />
47<br />
Bicycling & <strong>Walking</strong> in the U.S./ Thunderhead <strong>Alliance</strong> <strong>2007</strong>
