

2007 Benchmarking Report - Alliance for Biking & Walking
2007 Benchmarking Report - Alliance for Biking & Walking
2007 Benchmarking Report - Alliance for Biking & Walking

Create successful ePaper yourself
Turn your PDF publications into a flip-book with our unique Google optimized e-Paper software.
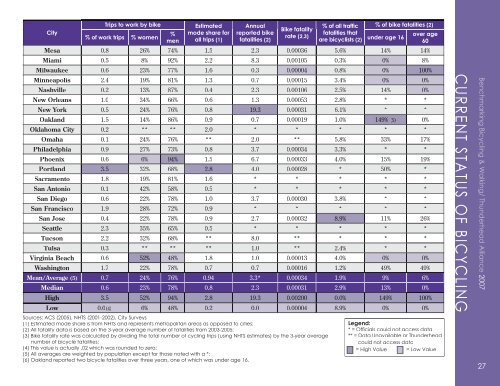
City<br />
Trips to work by bike<br />
% of work trips % women<br />
%<br />
men<br />
Estimated<br />
mode share <strong>for</strong><br />
all trips (1)<br />
Annual<br />
reported bike<br />
fatalities (2)<br />
Bike fatality<br />
rate (2,3)<br />
% of all traffic<br />
fatalities that<br />
are bicyclists (2)<br />
% of bike fatalities (2)<br />
under age 16<br />
Mesa 0.8 26% 74% 1.5 2.3 0.00036 5.6% 14% 14%<br />
Miami 0.5 8% 92% 2.2 8.3 0.00105 0.3% 0% 8%<br />
Milwaukee 0.6 23% 77% 1.6 0.3 0.00004 0.8% 0% 100%<br />
Minneapolis 2.4 19% 81% 1.3 0.7 0.00015 3.4% 0% 0%<br />
Nashville 0.2 13% 87% 0.4 2.3 0.00106 2.5% 14% 0%<br />
New Orleans 1.0 34% 66% 0.6 1.3 0.00053 2.8% * *<br />
New York 0.5 24% 76% 0.8 19.3 0.00031 6.1% * *<br />
Oakland 1.5 14% 86% 0.9 0.7 0.00019 1.0% 149% (5) 0%<br />
Oklahoma City 0.2 ** ** 2.0 * * * * *<br />
Omaha 0.1 24% 76% ** 2.0 ** 5.8% 33% 17%<br />
Philadelphia 0.9 27% 73% 0.8 3.7 0.00034 3.3% * *<br />
Phoenix 0.6 6% 94% 1.5 6.7 0.00033 4.0% 15% 19%<br />
Portland 3.5 32% 68% 2.8 4.0 0.00028 * 50% *<br />
Sacramento 1.8 19% 81% 1.6 * * * * *<br />
San Antonio 0.1 42% 58% 0.5 * * * * *<br />
San Diego 0.6 22% 78% 1.0 3.7 0.00030 3.8% * *<br />
San Francisco 1.9 28% 72% 0.9 * * * * *<br />
San Jose 0.4 22% 78% 0.9 2.7 0.00032 8.9% 11% 26%<br />
Seattle 2.3 35% 65% 0.5 * * * * *<br />
Tucson 2.2 32% 68% ** 8.0 ** * * *<br />
Tulsa 0.3 ** ** ** 1.0 ** 2.4% * *<br />
Virginia Beach 0.6 52% 48% 1.8 1.0 0.00013 4.0% 0% 0%<br />
Washington 1.7 22% 78% 0.7 0.7 0.00016 1.2% 49% 49%<br />
Mean/Average (5) 0.7 24% 76% 0.94 3.3* 0.00034 1.9% 9% 6%<br />
Median 0.6 23% 78% 0.8 2.3 0.00031 2.9% 13% 0%<br />
High 3.5 52% 94% 2.8 19.3 0.00200 0.0% 149% 100%<br />
Low 0.0(4) 6% 48% 0.2 0.0 0.00004 8.9% 0% 0%<br />
Sources: ACS (2005), NHTS (2001-2002), City Surveys<br />
(1) Estimated mode share is from NHTS and represents metropolitan areas as opposed to cities;<br />
(2) All fatality data is based on the 3-year average number of fatalities from 2003-2005;<br />
(3) Bike fatality rate was calculated by dividing the total number of cycling trips (using NHTS estimates) by the 3-year average<br />
number of bicycle fatalities;<br />
(4) This value is actually .02 which was rounded to zero;<br />
(5) All averages are weighted by population except <strong>for</strong> those noted with a *;<br />
(6) Oakland reported two bicycle fatalities over three years, one of which was under age 16.<br />
over age<br />
60<br />
Legend:<br />
* = Offi cials could not access data<br />
** = Data Unavailable or Thunderhead<br />
could not access data<br />
= High Value = Low Value<br />
CURRENT STATUS OF BICYCLING<br />
<strong>Benchmarking</strong> Bicycling Bicycling & <strong>Walking</strong> & <strong>Walking</strong>/ the U.S./ Thunderhead <strong>Alliance</strong> <strong>2007</strong> <strong>2007</strong><br />
27 27
