

2007 Benchmarking Report - Alliance for Biking & Walking
2007 Benchmarking Report - Alliance for Biking & Walking
2007 Benchmarking Report - Alliance for Biking & Walking

Create successful ePaper yourself
Turn your PDF publications into a flip-book with our unique Google optimized e-Paper software.
Bicycling & <strong>Walking</strong> in the U.S./ Thunderhead <strong>Alliance</strong> <strong>2007</strong><br />
50<br />
BICYCLING & WALKING POLICIES & PROVISIONS<br />
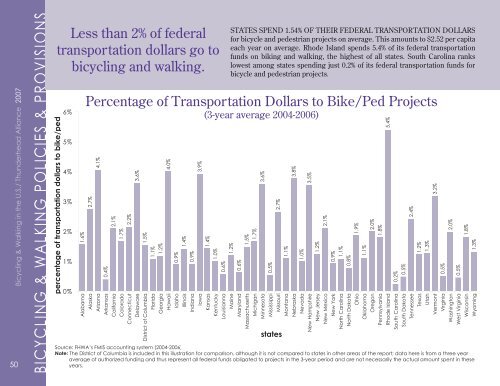
Less than 2% of federal<br />
transportation dollars go to<br />
bicycling and walking.<br />
percentage of transportation dollars to bike/ped<br />
6%<br />
5%<br />
4%<br />
3%<br />
2%<br />
1%<br />
0%<br />
1.6%<br />
Alabama<br />
2.7%<br />
Alaska<br />
4.1%<br />
Arizona<br />
0.4%<br />
Arkansas<br />
2.1%<br />
Cali<strong>for</strong>nia<br />
1.7%<br />
Colorado<br />
2.2%<br />
Connecticut<br />
3.6%<br />
Delaware<br />
1.5%<br />
District of Columbia<br />
1.1%<br />
Florida<br />
1.2%<br />
Georgia<br />
4.0%<br />
Hawaii<br />
0.9%<br />
Idaho<br />
1.4%<br />
Illinois<br />
0.9%<br />
Indiana<br />
3.9%<br />
Iowa<br />
1.4%<br />
Kansas<br />
1.0%<br />
Kentucky<br />
0.6%<br />
Louisianna<br />
STATES SPEND 1.54% OF THEIR FEDERAL TRANSPORTATION DOLLARS<br />
<strong>for</strong> bicycle and pedestrian projects on average. This amounts to $2.52 per capita<br />
each year on average. Rhode Island spends 5.4% of its federal transportation<br />
funds on biking and walking, the highest of all states. South Carolina ranks<br />
lowest among states spending just 0.2% of its federal transportation funds <strong>for</strong><br />
bicycle and pedestrian projects.<br />
% fed funds to bike ped<br />
Percentage of Transportation Dollars to Bike/Ped Projects<br />
(3-year average 2004-2006)<br />
1.2%<br />
Maine<br />
0.6%<br />
Maryland<br />
1.5%<br />
Massachusetts<br />
1.7%<br />
Michigan<br />
3.6%<br />
Minnesota<br />
0.5%<br />
Mississippi<br />
2.7%<br />
Missouri<br />
states<br />
Source: FHWA’s FMIS accounting system (2004-2006)<br />
Note: The District of Columbia is included in this illustration <strong>for</strong> comparison, although it is not compared to states in other areas of the report; data here is from a three year<br />
average of authorized funding and thus represent all federal funds obligated to projects in the 3-year period and are not necessarily the actual amount spent in these<br />
years.<br />
1.1%<br />
Montana<br />
3.8%<br />
Nebraska<br />
1.0%<br />
Nevada<br />
3.5%<br />
New Hampshire<br />
1.2%<br />
New Jersey<br />
2.1%<br />
New Mexico<br />
0.9%<br />
New York<br />
1.1%<br />
North Carolina<br />
0.8%<br />
North Dakota<br />
1.9%<br />
Ohio<br />
1.1%<br />
Oklahoma<br />
2.0%<br />
Oregon<br />
1.8%<br />
Pennsylvania<br />
5.4%<br />
Rhode Island<br />
0.2%<br />
South Carolina<br />
0.5%<br />
South Dakota<br />
2.4%<br />
Tennessee<br />
1.2%<br />
Texas<br />
1.3%<br />
Utah<br />
3.2%<br />
Vermont<br />
0.5%<br />
Virginia<br />
2.0%<br />
Washington<br />
0.5%<br />
West Virginia<br />
1.8%<br />
Wisconsin<br />
1.3%<br />
Wyoming
