

2007 Benchmarking Report - Alliance for Biking & Walking
2007 Benchmarking Report - Alliance for Biking & Walking
2007 Benchmarking Report - Alliance for Biking & Walking

You also want an ePaper? Increase the reach of your titles
YUMPU automatically turns print PDFs into web optimized ePapers that Google loves.
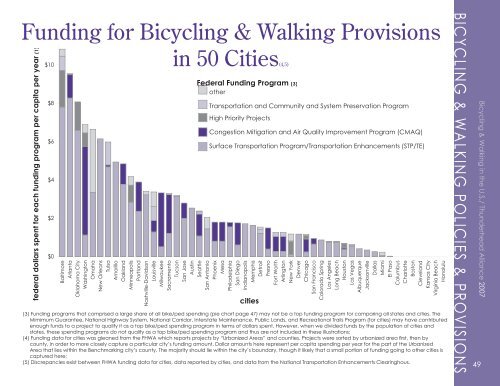
Funding <strong>for</strong> Bicycling & <strong>Walking</strong> Provisions<br />
federal dollars spent <strong>for</strong> each funding program per capita per year (1)<br />
$10<br />
$8<br />
$6<br />
$4<br />
$2<br />
$0<br />
Baltimore<br />
Atlanta<br />
Oklahoma City<br />
Washington<br />
Omaha<br />
New Orleans<br />
Tulsa<br />
Amarillo<br />
Oakland<br />
Minneapolis<br />
Portland<br />
Nashville-Davidson<br />
Louisville<br />
Milwaukee<br />
Sacramento<br />
in 50 Cities(4,5)<br />
Tucson<br />
San Jose<br />
Austin<br />
Federal Funding Program (3)<br />
other<br />
Seattle<br />
San Antonio<br />
Transportation and Community and System Preservation Program<br />
High Priority Projects<br />
Congestion Mitigation and Air Quality Improvement Program (CMAQ)<br />
Surface Transportation Program/Transportation Enhancements (STP/TE)<br />
Phoenix<br />
Mesa<br />
Philadelphia<br />
San Diego<br />
Indianapolis<br />
Memphis<br />
Detroit<br />
cities<br />
(3) Funding programs that comprised a large share of all bike/ped spending (pie chart page 47) may not be a top funding program <strong>for</strong> comparing all states and cities. The<br />
Mimimum Guarantee, National Highway System, National Corridor, Interstate Maintenance, Public Lands, and Recreational Trails Program (<strong>for</strong> cities) may have contributed<br />
enough funds to a project to qualify it as a top bike/ped spending program in terms of dollars spent. However, when we divided funds by the population of cities and<br />
states, these spending programs do not qualify as a top bike/ped spending program and thus are not included in these illustrations;<br />
(4) Funding data <strong>for</strong> cities was gleaned from the FHWA which reports projects by “Urbanized Areas” and counties. Projects were sorted by urbanized area first, then by<br />
county, in order to more closely capture a particular city’s funding amount. Dollar amounts here represent per capita spending per year <strong>for</strong> the part of the Urbanized<br />
Area that lies within the <strong>Benchmarking</strong> city’s county. The majority should lie within the city’s boundary, though it likely that a small portion of funding going to other cities is<br />
captured here;<br />
(5) Discrepancies exist between FHWA funding data <strong>for</strong> cities, data reported by cities, and data from the National Transportation Enhancements Clearinghous.<br />
Fresno<br />
Fort Worth<br />
Arlington<br />
New York<br />
Denver<br />
Chicago<br />
San Francisco<br />
Colorado Spring<br />
Los Angeles<br />
Long Beach<br />
Houston<br />
Las Vegas<br />
Albuquerque<br />
Jacksonville<br />
Dallas<br />
Miami<br />
El Paso<br />
Columbus<br />
Charlotte<br />
Boston<br />
Cleveland<br />
Kansas City<br />
Virginia Beach<br />
Honolulu<br />
BICYCLING & WALKING POLICIES & PROVISIONS<br />
49<br />
Bicycling & <strong>Walking</strong> in the U.S./ Thunderhead <strong>Alliance</strong> <strong>2007</strong>
