

2007 Benchmarking Report - Alliance for Biking & Walking
2007 Benchmarking Report - Alliance for Biking & Walking
2007 Benchmarking Report - Alliance for Biking & Walking

Create successful ePaper yourself
Turn your PDF publications into a flip-book with our unique Google optimized e-Paper software.
Bicycling & <strong>Walking</strong> in the U.S./ Thunderhead <strong>Alliance</strong> <strong>2007</strong><br />
CURRENT STATUS OF WALKING<br />
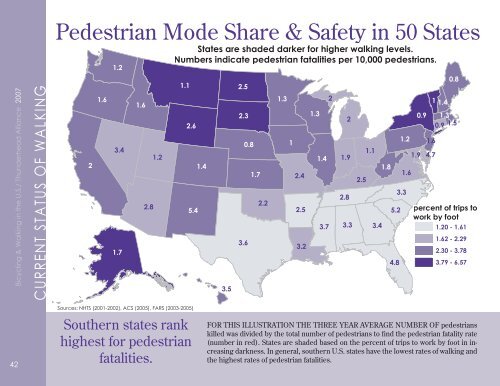
Pedestrian Mode Share & Safety in 50 States<br />
1.2<br />
Pedestrian Safety in 50 States<br />
States are shaded darker <strong>for</strong> higher walking levels.<br />
Numbers indicate pedestrian fatalities per 10,000 pedestrians.<br />
1.1<br />
2.5<br />
1.6<br />
1.6<br />
1.3<br />
2<br />
2.3<br />
1.3<br />
2.6<br />
0.8<br />
1<br />
3.4<br />
2<br />
1.2<br />
1.4<br />
1.4<br />
1.7<br />
2.4<br />
2.8<br />
5.4<br />
2.2<br />
2.5<br />
3.7<br />
3.6<br />
1.7<br />
3.2<br />
3.5<br />
0.8<br />
1 1.4<br />
0.9 1.3<br />
2<br />
0.9 1.5<br />
1.2 1.6<br />
1.1<br />
1.9<br />
1.9 4.7<br />
1.8<br />
1.6<br />
2.5<br />
3.3<br />
2.8<br />
5.2<br />
3.3 3.4<br />
4.8<br />
percent of trips to<br />
work % trips by to foot work on foot<br />
1.20 - 1.61<br />
1.62 - 2.29<br />
2.30 - 3.78<br />
3.79 - 6.57<br />
42<br />
Sources: NHTS (2001-2002), ACS (2005), FARS (2003-2005)<br />
Southern states rank<br />
highest <strong>for</strong> pedestrian<br />
Sources: NHTS, FARS, ACS 2005<br />
fatalities.<br />
FOR THIS ILLUSTRATION THE THREE YEAR AVERAGE NUMBER OF pedestrians<br />
killed was divided by the total number of pedestrians to find the pedestrian fatality rate<br />
(number in red). States are shaded based on the percent of trips to work by foot in increasing<br />
darkness. In general, southern U.S. states have the lowest rates of walking and<br />
Number in re indicates Pedestrian Risk of Death, per 10,000 pedestrians<br />
the highest rates of pedestrian fatalities.
