

2007 Benchmarking Report - Alliance for Biking & Walking
2007 Benchmarking Report - Alliance for Biking & Walking
2007 Benchmarking Report - Alliance for Biking & Walking

You also want an ePaper? Increase the reach of your titles
YUMPU automatically turns print PDFs into web optimized ePapers that Google loves.
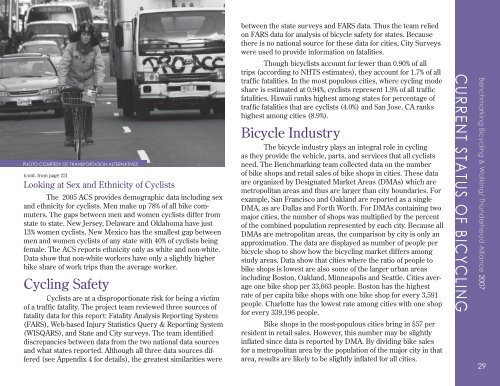
PHOTO COURTESY OF TRANSPORTATION ALTERNATIVES<br />
(cont. from page 22)<br />
Looking at Sex and Ethnicity of Cyclists<br />
The 2005 ACS provides demographic data including sex<br />
and ethnicity <strong>for</strong> cyclists. Men make up 78% of all bike commuters.<br />
The gaps between men and women cyclists differ from<br />
state to state. New Jersey, Delaware and Oklahoma have just<br />
13% women cyclists. New Mexico has the smallest gap between<br />
men and women cyclists of any state with 40% of cyclists being<br />
female. The ACS reports ethnicity only as white and non-white.<br />
Data show that non-white workers have only a slightly higher<br />
bike share of work trips than the average worker.<br />
Cycling Safety<br />
Cyclists are at a disproportionate risk <strong>for</strong> being a victim<br />
of a traffic fatality. The project team reviewed three sources of<br />
fatality data <strong>for</strong> this report: Fatality Analysis <strong>Report</strong>ing System<br />
(FARS), Web-based Injury Statistics Query & <strong>Report</strong>ing System<br />
(WISQARS), and State and City surveys. The team identified<br />
discrepancies between data from the two national data sources<br />
and what states reported. Although all three data sources differed<br />
(see Appendix 4 <strong>for</strong> details), the greatest similarities were<br />
between the state surveys and FARS data. Thus the team relied<br />
on FARS data <strong>for</strong> analysis of bicycle safety <strong>for</strong> states. Because<br />
there is no national source <strong>for</strong> these data <strong>for</strong> cities, City Surveys<br />
were used to provide in<strong>for</strong>mation on fatalities.<br />
Though bicyclists account <strong>for</strong> fewer than 0.90% of all<br />
trips (according to NHTS estimates), they account <strong>for</strong> 1.7% of all<br />
traffic fatalities. In the most populous cities, where cycling mode<br />
share is estimated at 0.94%, cyclists represent 1.9% of all traffic<br />
fatalities. Hawaii ranks highest among states <strong>for</strong> percentage of<br />
traffic fatalities that are cyclists (4.0%) and San Jose, CA ranks<br />
highest among cities (8.9%).<br />
Bicycle Industry<br />
The bicycle industry plays an integral role in cycling<br />
as they provide the vehicle, parts, and services that all cyclists<br />
need. The <strong>Benchmarking</strong> team collected data on the number<br />
of bike shops and retail sales of bike shops in cities. These data<br />
are organized by Designated Market Areas (DMAs) which are<br />
metropolitan areas and thus are larger than city boundaries. For<br />
example, San Francisco and Oakland are reported as a single<br />
DMA, as are Dallas and Forth Worth. For DMAs containing two<br />
major cities, the number of shops was multiplied by the percent<br />
of the combined population represented by each city. Because all<br />
DMAs are metropolitan areas, the comparison by city is only an<br />
approximation. The data are displayed as number of people per<br />
bicycle shop to show how the bicycling market differs among<br />
study areas. Data show that cities where the ratio of people to<br />
bike shops is lowest are also some of the larger urban areas<br />
including Boston, Oakland, Minneapolis and Seattle. Cities average<br />
one bike shop per 33,663 people. Boston has the highest<br />
rate of per capita bike shops with one bike shop <strong>for</strong> every 3,591<br />
people. Charlotte has the lowest rate among cities with one shop<br />
<strong>for</strong> every 339,196 people.<br />
Bike shops in the most-populous cities bring in $57 per<br />
resident in retail sales. However, this number may be slightly<br />
inflated since data is reported by DMA. By dividing bike sales<br />
<strong>for</strong> a metropolitan area by the population of the major city in that<br />
area, results are likely to be slightly inflated <strong>for</strong> all cities.<br />
CURRENT STATUS OF BICYCLING<br />
<strong>Benchmarking</strong> Bicycling Bicycling & <strong>Walking</strong> & <strong>Walking</strong>/ the U.S./ Thunderhead <strong>Alliance</strong> <strong>2007</strong> <strong>2007</strong><br />
29 29
