

2007 Benchmarking Report - Alliance for Biking & Walking
2007 Benchmarking Report - Alliance for Biking & Walking
2007 Benchmarking Report - Alliance for Biking & Walking

You also want an ePaper? Increase the reach of your titles
YUMPU automatically turns print PDFs into web optimized ePapers that Google loves.
Bicycling & <strong>Walking</strong> in the U.S./ Thunderhead <strong>Alliance</strong> <strong>2007</strong><br />
20<br />
CURRENT STATUS OF BICYCLING<br />
percent<br />
Overview of<br />
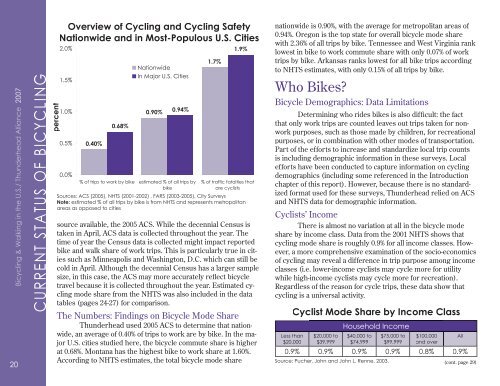
Cycling and Cycling Safety Nationwide and nationwide in is 0.90%, with the average <strong>for</strong> metropolitan areas of<br />
Major U.S. Cities<br />
0.94%. Oregon is the top state <strong>for</strong> overall bicycle mode share<br />
with 2.36% of all trips by bike. Tennessee and West Virginia rank<br />
1.9%<br />
lowest in bike to work commute share with only 0.07% of work<br />
1.7%<br />
trips by bike. Arkansas ranks lowest <strong>for</strong> all bike trips according<br />
Nationwide<br />
to NHTS estimates, with only 0.15% of all trips by bike.<br />
Overview of Cycling and Cycling Safety<br />
Nationwide and in Most-Populous U.S. Cities<br />
2.0%<br />
1.5%<br />
1.0%<br />
0.5%<br />
0.0%<br />
0.40%<br />
0.68%<br />
% of trips to work by bike<br />
In Major U.S. Cities<br />
0.90%<br />
estimated % of all<br />
bike<br />
0.94%<br />
trips by<br />
% of traffic fatalties<br />
are cyclists<br />
Sources: ACS (2005), NHTS (2001-2002) , FARS (2003-2005), City Surveys<br />
Note: estimated % of all trips by bike is from NHTS and represents metropolitan<br />
areas as opposed to cities<br />
source available, the 2005 ACS. While the decennial Census is<br />
taken in April, ACS data is collected throughout the year. The<br />
time of year the Census data is collected might impact reported<br />
bike and walk share of work trips. This is particularly true in cities<br />
such as Minneapolis and Washington, D.C. which can still be<br />
cold in April. Although the decennial Census has a larger sample<br />
size, in this case, the ACS may more accurately reflect bicycle<br />
travel because it is collected throughout the year. Estimated cycling<br />
mode share from the NHTS was also included in the data<br />
tables (pages 24-27) <strong>for</strong> comparison.<br />
The Numbers: Findings on Bicycle Mode Share<br />
Thunderhead used 2005 ACS to determine that nationwide,<br />
an average of 0.40% of trips to work are by bike. In the major<br />
U.S. cities studied here, the bicycle commute share is higher<br />
at 0.68%. Montana has the highest bike to work share at 1.60%.<br />
According to NHTS estimates, the total bicycle mode share<br />
that<br />
Who Bikes<br />
Bicycle Demographics: Data Limitations<br />
Determining who rides bikes is also difficult: the fact<br />
that only work trips are counted leaves out trips taken <strong>for</strong> nonwork<br />
purposes, such as those made by children, <strong>for</strong> recreational<br />
purposes, or in combination with other modes of transportation.<br />
Part of the ef<strong>for</strong>ts to increase and standardize local trip counts<br />
is including demographic in<strong>for</strong>mation in these surveys. Local<br />
ef<strong>for</strong>ts have been conducted to capture in<strong>for</strong>mation on cycling<br />
demographics (including some referenced in the Introduction<br />
chapter of this report). However, because there is no standardized<br />
<strong>for</strong>mat used <strong>for</strong> these surveys, Thunderhead relied on ACS<br />
and NHTS data <strong>for</strong> demographic in<strong>for</strong>mation.<br />
Cyclists’ Income<br />
There is almost no variation at all in the bicycle mode<br />
share by income class. Data from the 2001 NHTS shows that<br />
cycling mode share is roughly 0.9% <strong>for</strong> all income classes. However,<br />
a more comprehensive examination of the socio-economics<br />
of cycling may reveal a difference in trip purpose among income<br />
classes (i.e. lower-income cyclists may cycle more <strong>for</strong> utility<br />
while high-income cyclists may cycle more <strong>for</strong> recreation).<br />
Regardless of the reason <strong>for</strong> cycle trips, these data show that<br />
cycling is a universal activity.<br />
Less than<br />
$20,000<br />
Cyclist Mode Share by Income Class<br />
$20,000 to<br />
$39,999<br />
Household Income<br />
$40,000 to<br />
$74,999<br />
$75,000 to<br />
$99,999<br />
$100,000<br />
and over<br />
0.9% 0.9% 0.9% 0.9% 0.8% 0.9%<br />
Source: Pucher, John and John L. Renne, 2003. (cont. page 29)<br />
All
